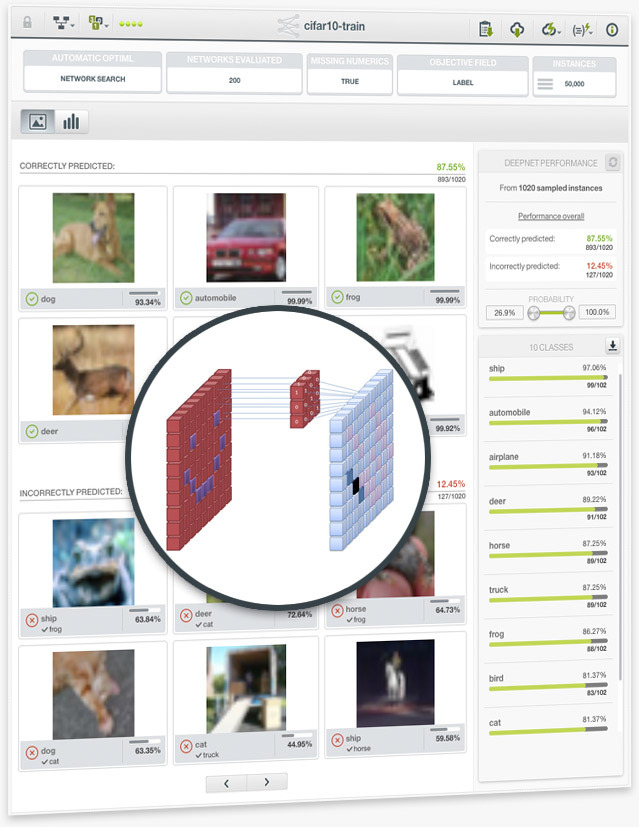
BigML introduces Convolutional Neural Network (CNN), the most popular machine learning technique for image classification.
When a dataset contains images and it is used to train a Deepnet, BigML’s resource for deep neural networks, the Deepnet will be a CNN. The BigML platform abstracts away hardware complexity so users do not need to worry about infrastructure setup such as GPU installation. Moreover, just like any other model, users can employ 1-click CNN and automatic parameter optimization to accommodate their use cases.
Please visit the Image Processing page to learn more.
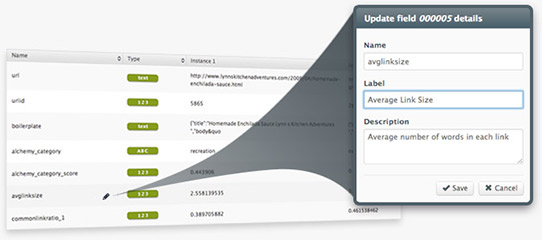
The inclusion of configurable image features makes machine learning with images beautifully simple for everyone. Users can use image features to train all sorts of models, both supervised and unsupervised, greatly expanding their business scopes and enhancing their Machine Learning workflows.
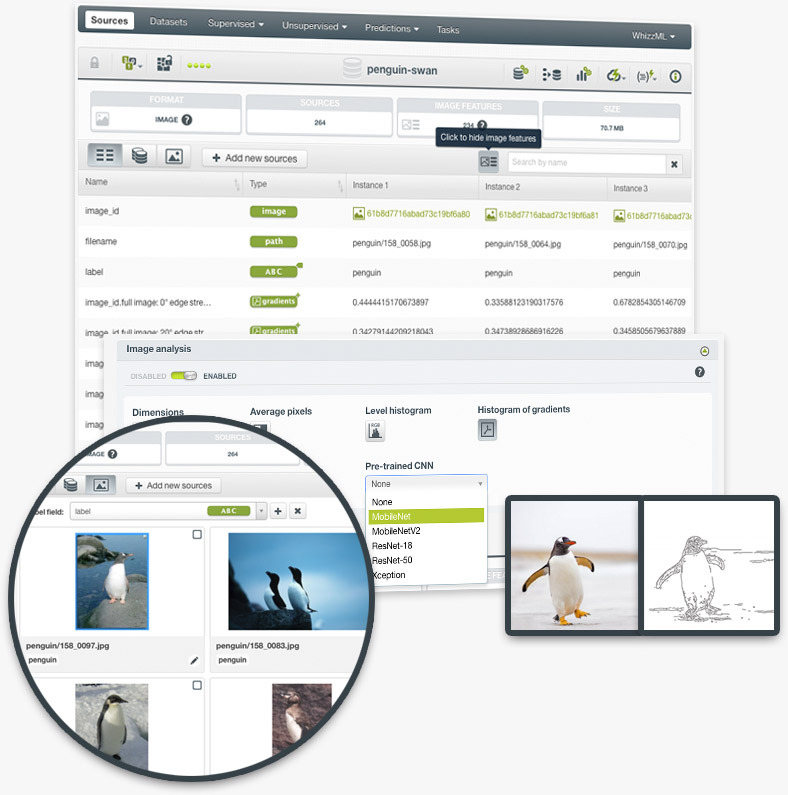
Image features are sets of numeric fields extracted from images. They can capture parts or patterns of images, such as edges, colors, and textures. The image features extracted by pre-trained CNNs capture more complex patterns. Now, BigML allows users to configure different image features at the source level.
Please visit the Image Processing release page to learn more.
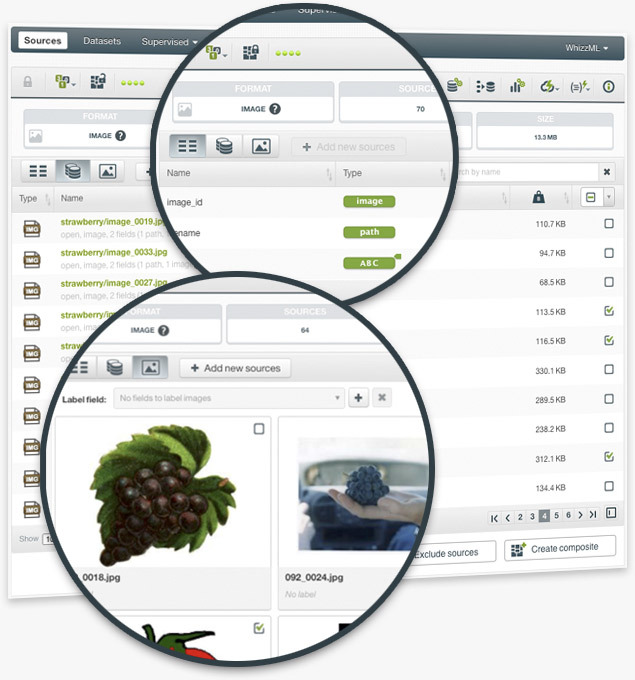
BigML introduces composite sources, a new type of source that augments its Machine Learning capabilities. Image composite sources are collections of images, and play a central role in BigML Image Processing. As such, users can preview, add or remove images in composite sources, as well as extract image features and add labels.
A composite source is a collection of other sources, called components. The power and flexibility of a composite source lie in its ability to allow many types of component sources, including other composite sources. Furthermore, users can manipulate composite sources by performing operations on their components, such as addition and exclusion.
You can find more details about composite sources here.
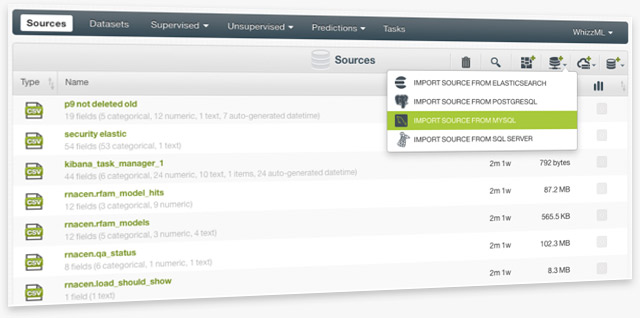
BigML now supports creating sources directly from your databases. You can also create sources from your Elasticsearch engine. Both the BigML Dashboard and the API allow you to establish a connector to your databases or Elasticsearch by providing connection parameters and authentication information. BigML can then connect to your database or engine and create sources in BigML's server. You have the options to import data from individual tables or to do it selectively by specifying the data with your own queries.
Please visit the release page to learn more.
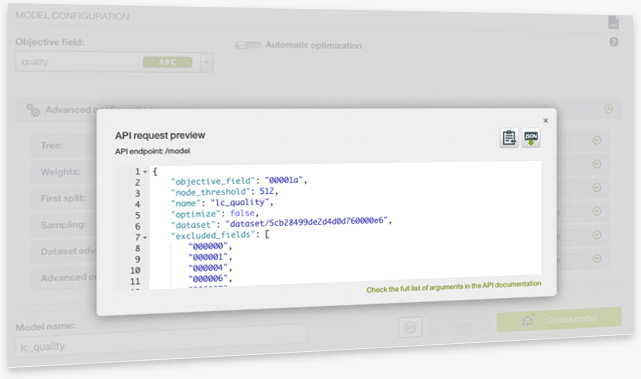
Anything you create on BigML Dashboard, you can do the same with BigML API. Now BigML adds the feature of previewing an API request alongside the configuration of a resource creation on the Dashboard.
This essentially shows the users how to create the resource programmatically. It includes the endpoint of the REST API call and the JSON file that specifies the arguments that had been configured.
Find more information in the BigML Dashboard documentation.
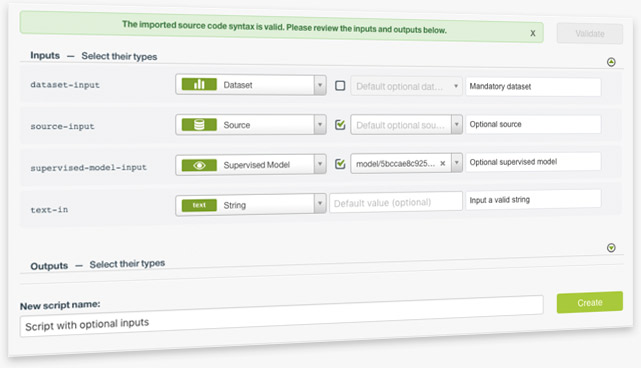
When you use WhizzML scripts, some inputs may be mandatory, some optional. You may also provide default values to inputs. You can specify them in the corresponding JSON metadata files. Now you can do this on the BigML Dashboard: when inputs are resources, such as sources, datasets and models, BigML provides checkboxes for users to toggle between these inputs being mandatory or optional. Users also have the option to provide default values for those inputs or leave them empty.
Please visit the release page to learn more about this feature.
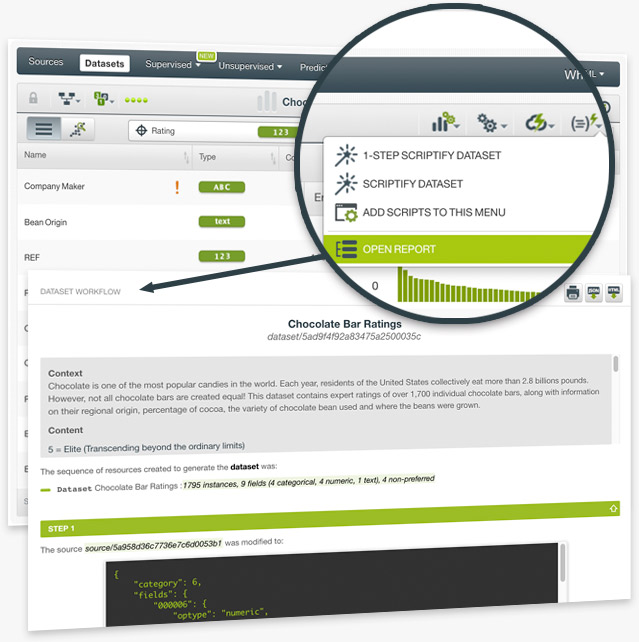
With a single click, produce a human readable report describing the exact steps followed to execute your workflow. You can share the output with colleagues to bring them up to speed or as a personal record of the process you followed.
You can produce a Workflow Report easily for any resource. Just navigate to the Workflow Report option found under the scripts menu. BigML instantaneously runs a Scriptfy job and creates your report.
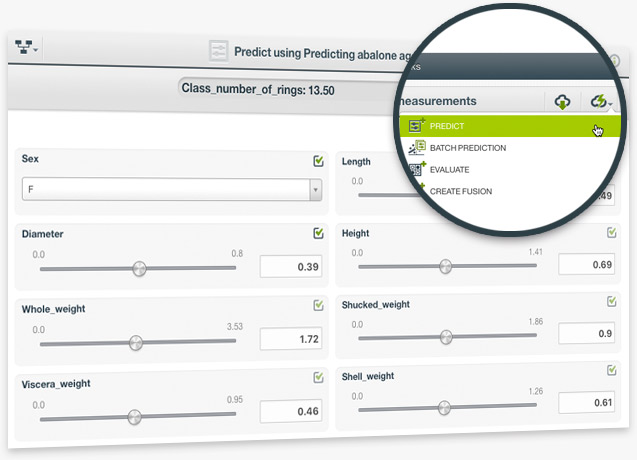
The ultimate goal of creating a linear regression is to make predictions with it. Linear regression is a regression model that predicts numeric values.
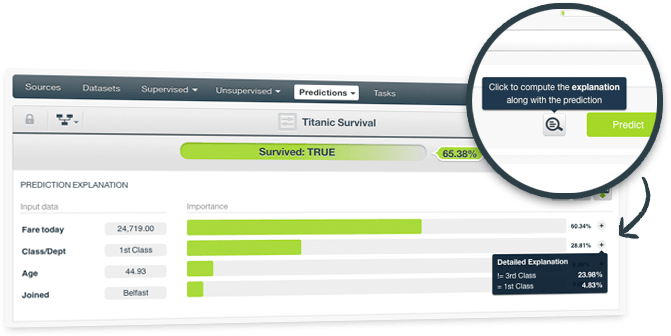
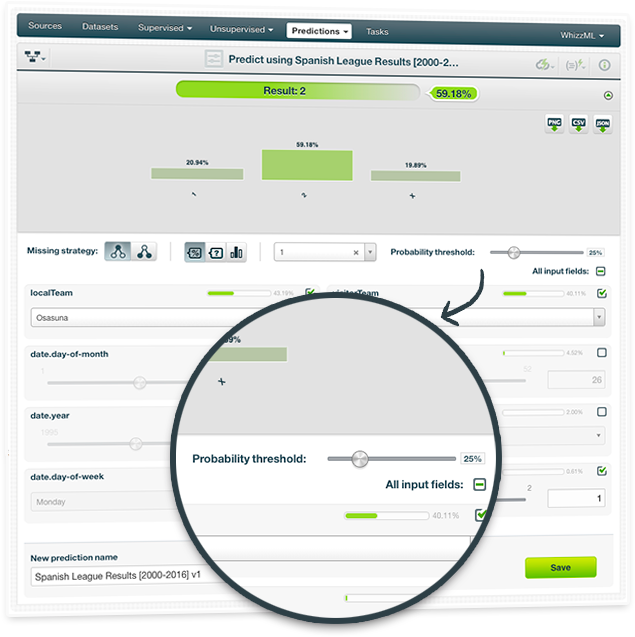
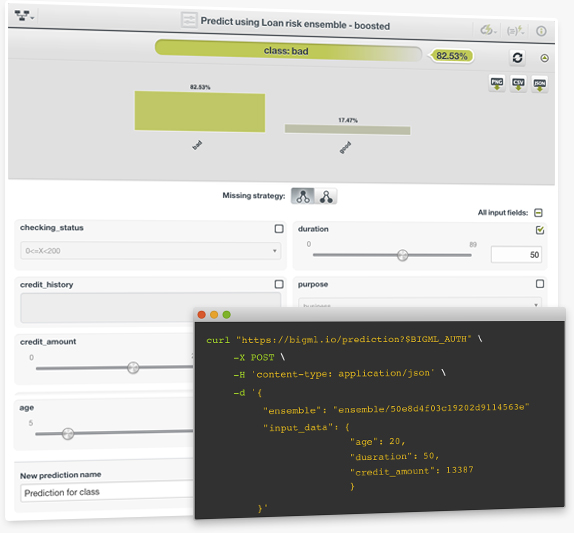
You can perform single predictions with linear regression, if you want to predict just one instance. This is easily achieved by using BigML prediction form —just input the values for the fields used by the linear regression. You can also ask for the prediction explanation, i.e., the per-field importance in the prediction.
BigML batch predictions allow you to predict multiple instances with one-click. Just select the linear regression and the dataset containing the data you want to predict, and BigML will automatically generate an output CSV file with a prediction for each of your instances. A wide range of the output file settings can be configured. Learn more about linear regressions here.
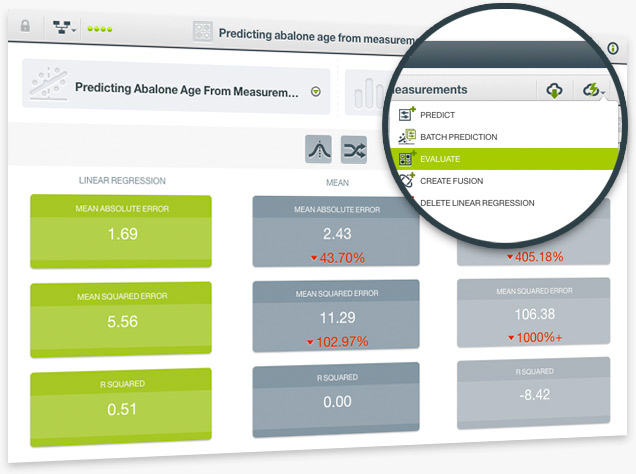
Evaluate the performance of your Linear Regressions to get an estimate of how good your model is at making predictions for new data. As with other supervised regression models, the resulting performance metrics of linear regression evaluations includes three measures: Mean Absolute Error, Mean Squared Error and R Squared. BigML also provides the measures of two other types of models to compare against your model performance. You can find explanations for these measures in the documentation.
BigML adds Linear Regression to our collection of supervised learning methods. Linear Regression is a well known algorithm that discovers relationships between input fields and the objective field. BigML’s implementation can support any type of field, including numerical, categorical, text, items fields, and can even handle missing values.
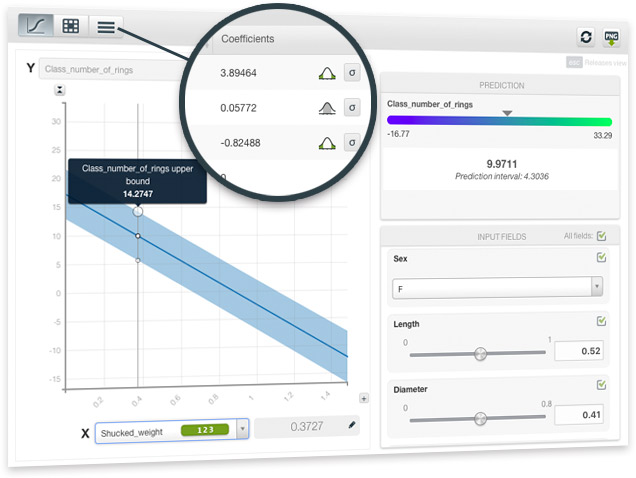
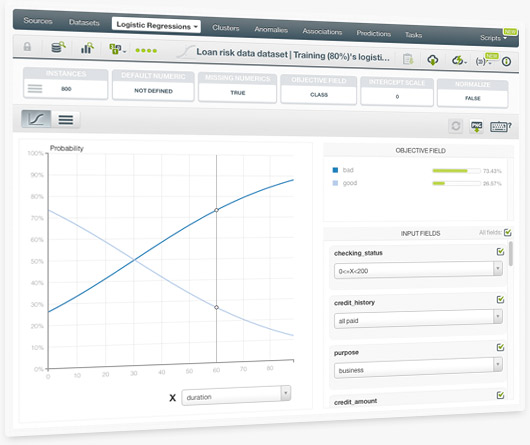
BigML Visualization for linear regression includes three views: a 1D chart, a Partial Dependence Plot (PDP) and a coefficient table. The 1D chart and PDP provide visual ways to analyze the impact of your input fields on predictions. The table shows all the coefficients learned for each of the variables of the linear function, which is useful for inspecting model results.
Learn more about Linear Regression on the release page.
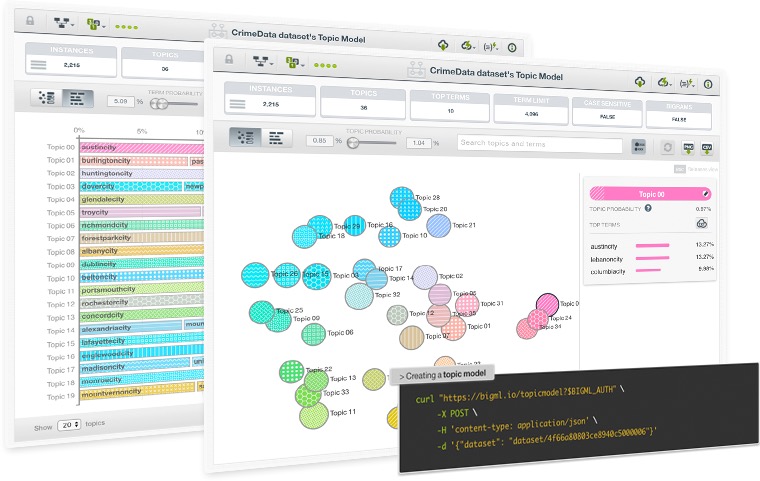
When you create a topic model in BigML, your topics get default names. Until now the names were set as "Topic 00", "Topic 01", and so on. Now BigML takes the top term per topic as the default name, aiming to provide more descriptive names for your future topic models.
If two topics share the first top term the next most likely term will also be included in the topic names. You can configure this setting and return to the old naming or increase the number of terms that you want to be included per topic name.
Please read the section 4.4 Minimum Terms Per Topic Name in the Topic Model documentation.
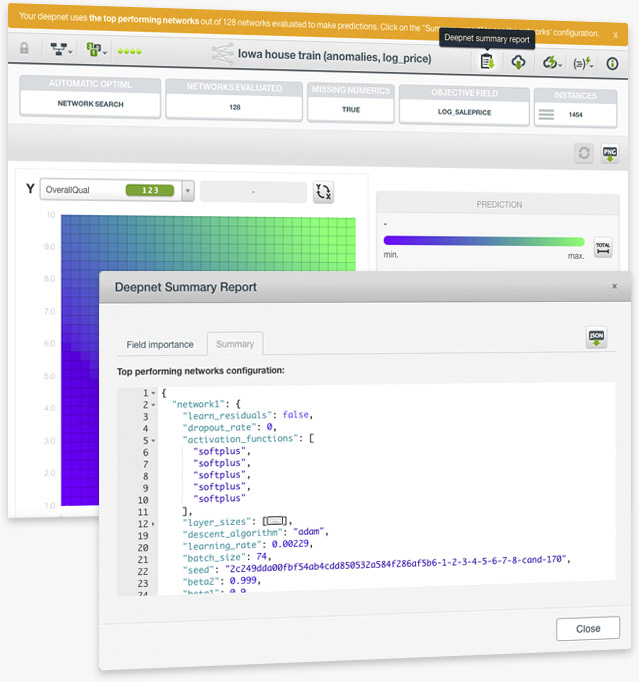
When you use the Automatic Network Search option to find the optimal parametrization of your deepnets, the final deepnet is usually composed of multiple networks with different configurations (read the section 4.4.2 Automatic Parameter Optimization of the deepnet document). These configuration parameters were hidden to the user until now. To address the requests from our most technical customers and provide a higher level of interpretability, BigML displays the configuration for each of the networks composing a deepnet created with this automatic option.
Please read the section 4.5.2.2 Summary of the deepnet documentation to learn more
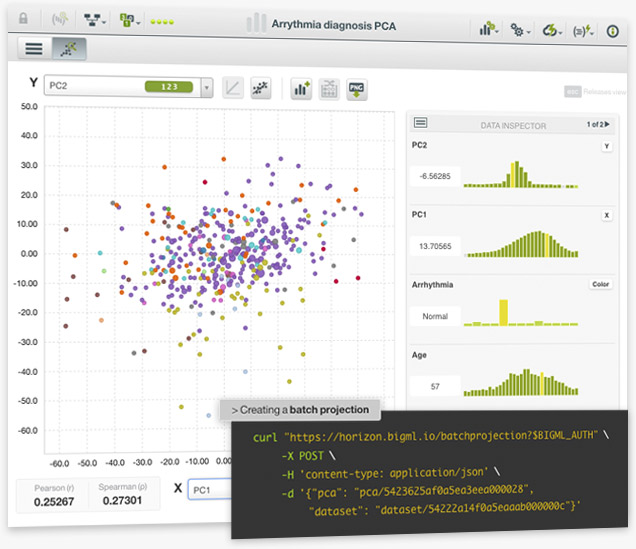
You can use your Principal Component Analysis (PCA) models to calculate the components for the same data or new data that the model has not yet seen. Predictions for PCA are referred to as projections in BigML since they can be used to project new data points to a new set of axes defined by the principal components.
When PCA is applied with the goal of dimensionality reduction, it is usually the case to set a threshold to select a subset of the principal components yielded by a PCA to transform a given dataset. You can select this subset of components in BigML either by setting a threshold for the cumulative variance explained by the components or by limiting the total number of components. The resulting dataset can be visualized in the Dashboard using the standard scatterplot. The axes can then be set to the principal components of interest, with PC1 and PC2 being the standard options to view the dimensions that display the greatest variance in the data.
Learn more about PCA on the release page.
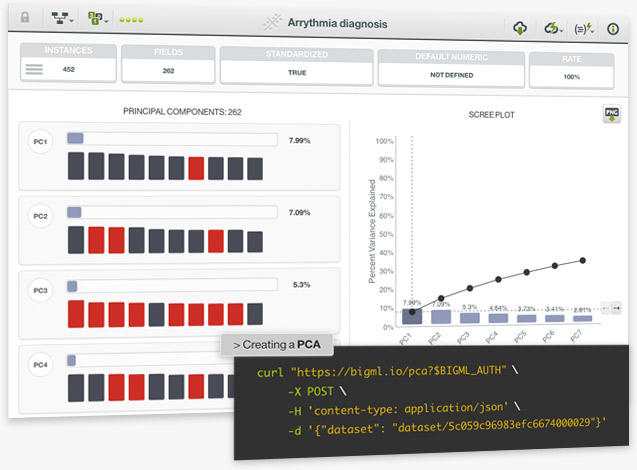
BigML is proud to announce the integration of a new unsupervised method in our platform: Principal Component Analysis (PCA). PCA is a statistical technique that transforms a dataset defined by possibly correlated variables (whose noise negatively affects the performance of your model) into a set of uncorrelated variables, called principal components. This technique is used as the first step in dimensionality reduction, especially for datasets with a large number of variables, which helps improve the performance of supervised models. BigML’s unique approach can handle numeric and non-numeric data types, including text, categorical, items fields, as well as combinations of different data types.
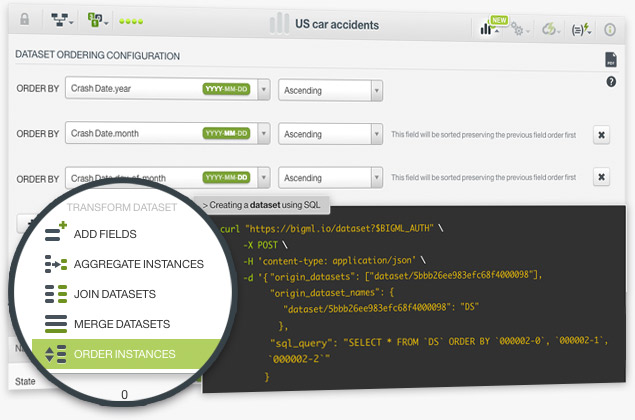
The ordering instances option in BigML allows you to sort the rows of a dataset by one or more selected fields in ascending or descending order. The instances will be sorted first by the first selected field, then by the second field, and so on. You can select up to 8 different sorting fields.
This option is very useful for time series, when you have a dataset containing a date field and you need to sort your instances chronologically.
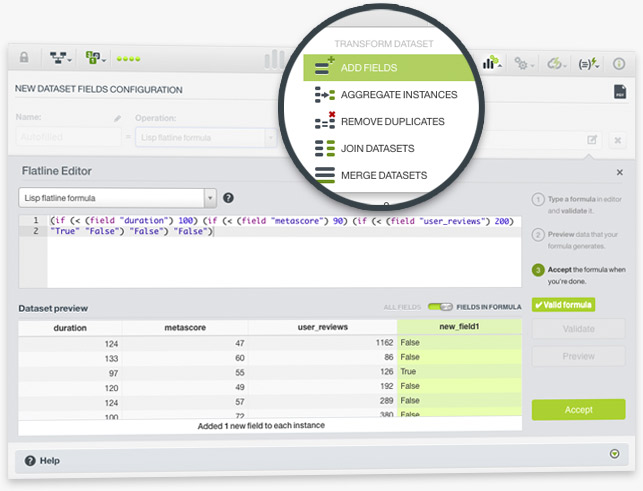
The BigML Flatline Editor has been upgraded to easily help you create new fields and validate existing Flatline expressions in your Dashboard. Flatline is BigML's domain-specific language for data generation and filtering, which helps you to perform an infinite number of calculations on top of your dataset fields.
BigML included a table-like dataset preview where you can easily see a sample of your instances. When you write a formula and you want to view its result, the preview only shows the fields involved in the formula. That way you can quickly check if your formula is being calculated correctly. Moreover, BigML also included a formula autocompletion so it's convenient to see which operators and dataset fields you can use while writing in the editor.
Find more information in the Datasets with the BigML Dashboard document.
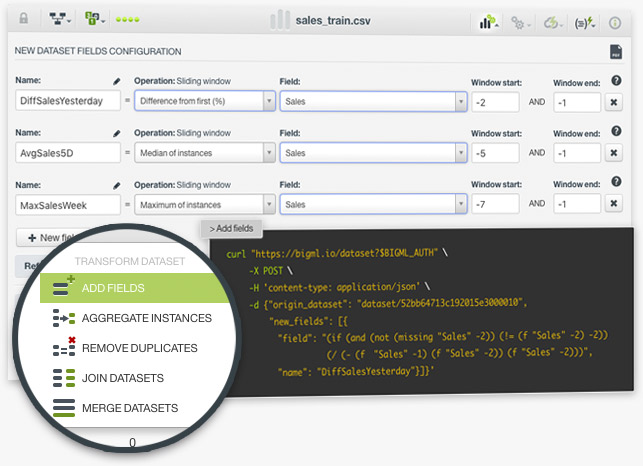
Creating new features using sliding windows is one of the most common feature engineering techniques in Machine Learning. It is usually applied to frame time series data using previous data points as new input fields to predict the next time data points. For example, imagine we have one year of sales data to predict sales, we can use our sales field to create an infinite number of fields containing past data: last day sales, the average of last week sales, the difference between last month and this month sales, etc. To set up an sliding window in BigML you just need to choose the operation you want to apply to the instances in the window and define a window start and end.
Find more information in the Datasets with the BigML Dashboard document.
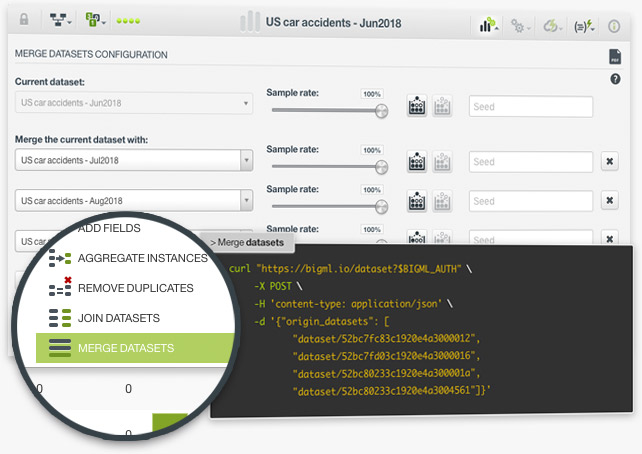
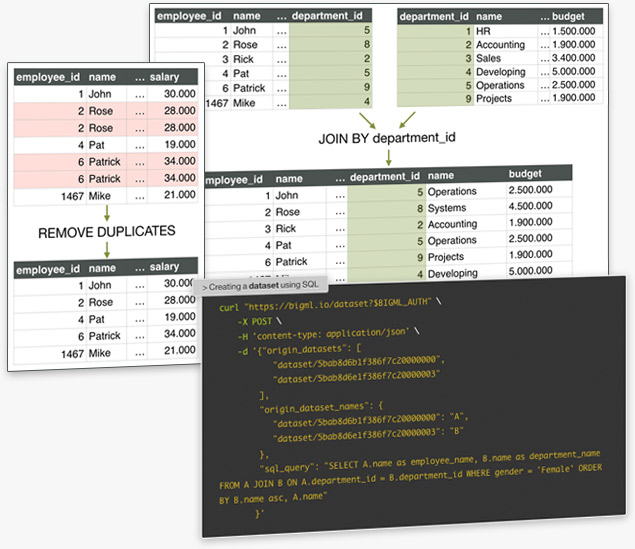
The merging datasets option in BigML allows you to include the instances of several datasets in one dataset. This functionality can be very useful when you use multiple sources of data. For example, imagine that you collect data on an hourly basis and want to create a dataset aggregating data collected over the whole day. You only need to send the new data generated each hour to BigML, create a source and a dataset for each one, and then merge all the individual datasets into one at the end of the day.
Find more information in the Datasets with the BigML Dashboard document.
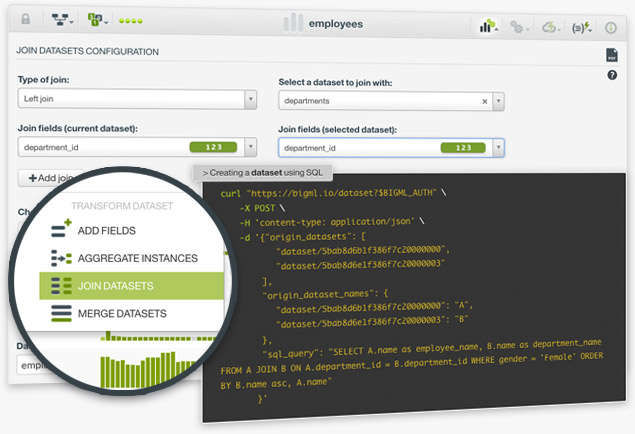
BigML allows you to join several datasets to combine their fields and instances based on one or more related fields between them. This is very useful when your data is scattered in two or more datasets. For example, imagine you have employee data in one dataset and department data in another dataset. You can add the department information per employee if you have a common field to join them such as department_id.
Find more information in the Datasets with the BigML Dashboard document.
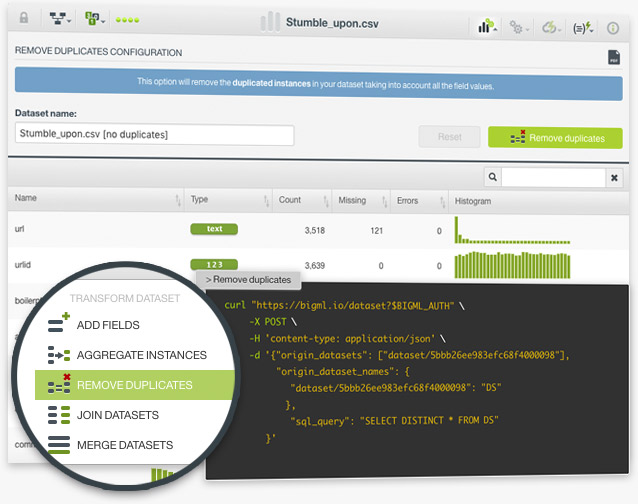
Duplicated instances in a dataset can be problematic for training Machine Learning models. For example, if you make a random split of your dataset and you take one subset for training and other for testing, it's likely that these duplicated instances appear in both subsets, which will give you an unrealistically good performance of your model. With BigML you can now easily remove the duplicated instances in your datasets with one click.
Find more information in the Datasets with the BigML Dashboard document.
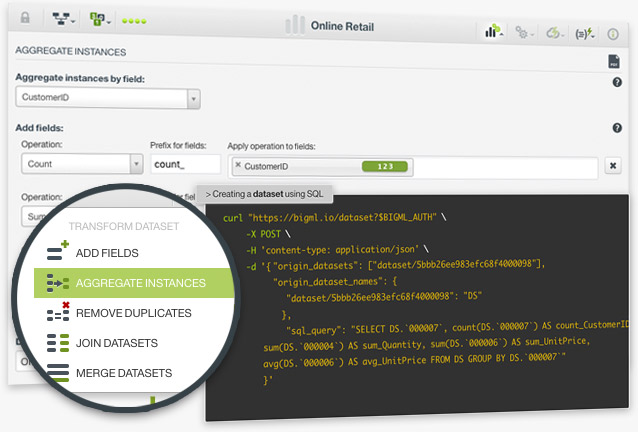
The aggregating instances option in BigML allows you to group the rows of a dataset by a given field. This is a very common case in Machine Learning. For example, imagine you have a dataset in which each instance is a purchase but you want to make an analysis based on customers, not purchases. In this case, you need to group your instances per customer to have a customer per row instead of a purchase.
In BigML, you can also perform multiple aggregation operations on top of the dataset fields such as sum, average, maximum, minimum, count, and count distinct, among others.
Find more information in the Datasets with the BigML Dashboard document.
The BigML team is proud to announce SQL capabilities in the BigML API . This new feature opens up an infinite number of transformations to prepare your data for Machine Learning. The ability to freely write SQL statements will be an API-only feature for now; however, we are bringing some common transformations to the Dashboard for users that prefer to transform their data in a few clicks: aggregate instances, remove duplicates, join and merge datasets. The idea is to add more options in the Dashboard on an ongoing basis; for example, the ability to order instances.
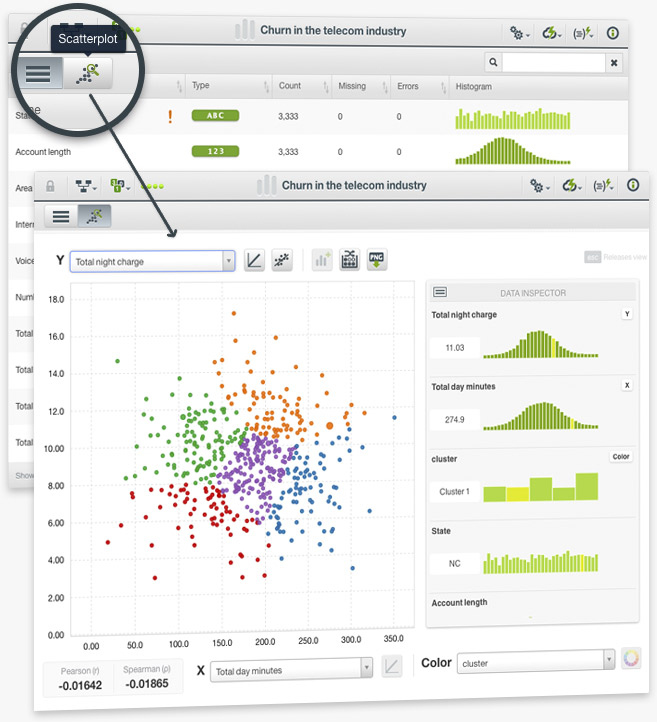
The scatterplot has been licensed from Labs (our playground environment for new experiments) to the BigML Dashboard. This visual chart allows you to look at correlations and other interesting relationships between the categorical and numeric fields in your datasets. The scatterplot is the starting point to add more visualizations for your dataset in the future such as stacked bar charts or maps for geo-data.
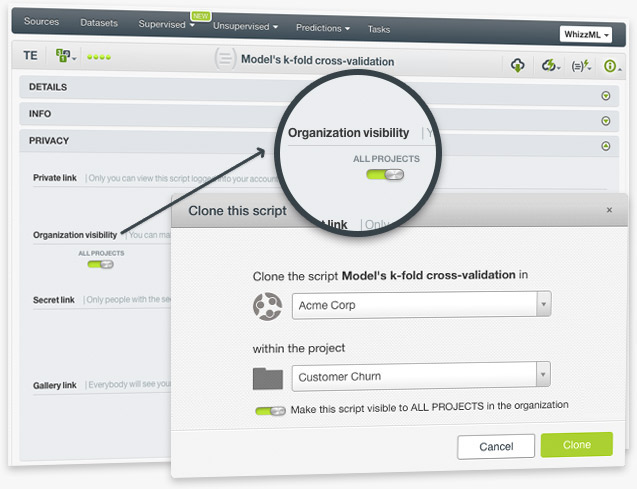
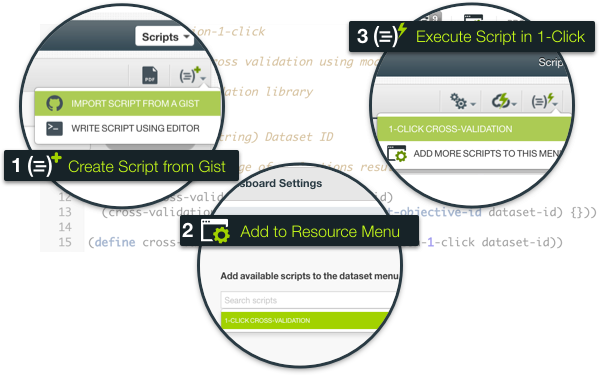
Until now, the scripts in an Organization belonged to a single project, which meant popular scripts had to be manually added to multiple projects. Now, you can make a script public for all the projects in your Organization, so you can share common scripts like cross-validation or feature selection with all users across all projects in a single click. Moreover, you can add those public scripts to your Dashboard menus and they will automatically be visible in all the projects in a given Organization.
The script owner and Organization admins can always revert this setting by using the switch within the script info panel, and the script will only appear in the original project where it was created.
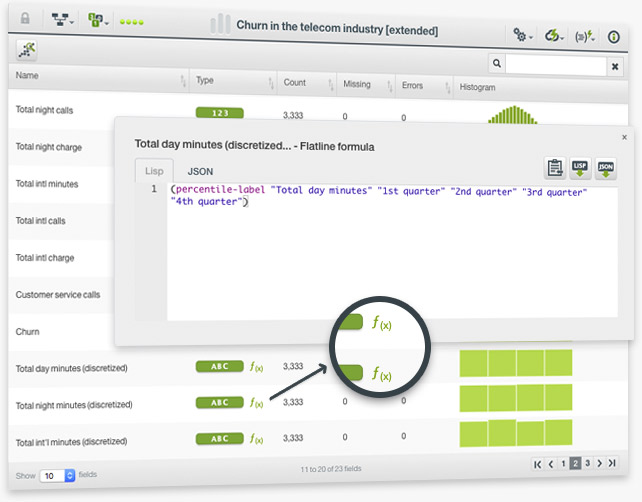
You can create new fields for your dataset if you choose the option "Add fields" from the dataset configuration menu in the Dashboard. Then you can either use our pre-defined options or the Flatline editor to create the field. Both options use BigML’s domain-specific language Flatline to generate the new fields.
Now, each time you create a new field for your dataset, you will be able to see the Flatline formula used to create it. You can easily copy and paste this formula to recreate a similar field for another dataset.
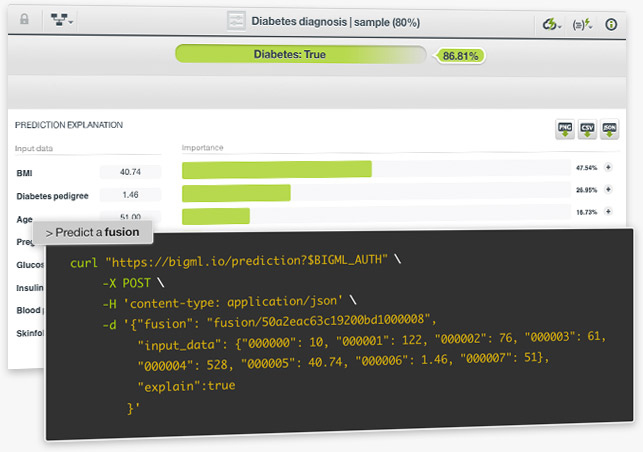
One of the main goals of building a Fusion is to make predictions with it. Fusions can be used to predict categorical or numeric values. For classification problems, fusions average the per-class probabilities across all the component models. The class with the highest probability is predicted. For regression models, the final prediction is the result of averaging the per-model predicted values.
You can perform single predictions with fusions, if you want to predict just one instance; or batch predictions if you want to predict multiple instances at the same time. For single predictions you can ask for the prediction explanation, i.e., the per-field importances in the prediction. Learn more about fusions here!
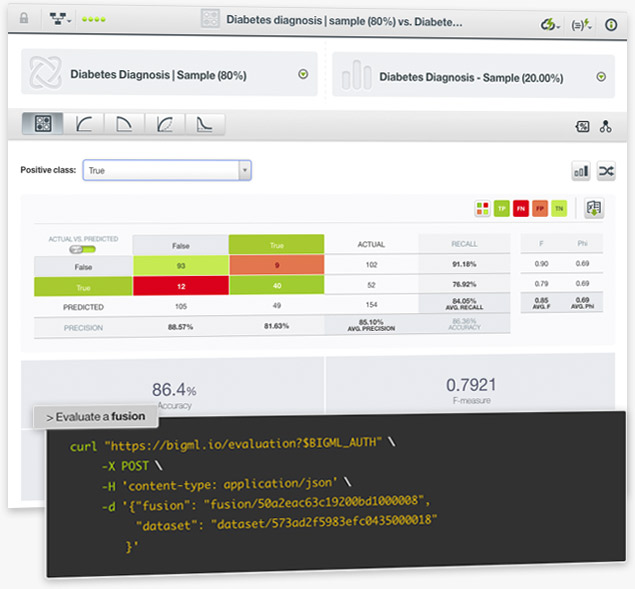
Evaluate the performance of your Fusions to get an estimate of how good your model is at making predictions for new data. As with other supervised learning models, easily interpret the results with BigML evaluation visualizations such as the confusion matrix, the Precision-Recall, ROC, Gain and Lift curves for classification models. Since Fusion evaluations use the same performance metrics as other classification or regression models, you can quickly compare them with the BigML evaluation comparison tool. Learn more about fusions here!
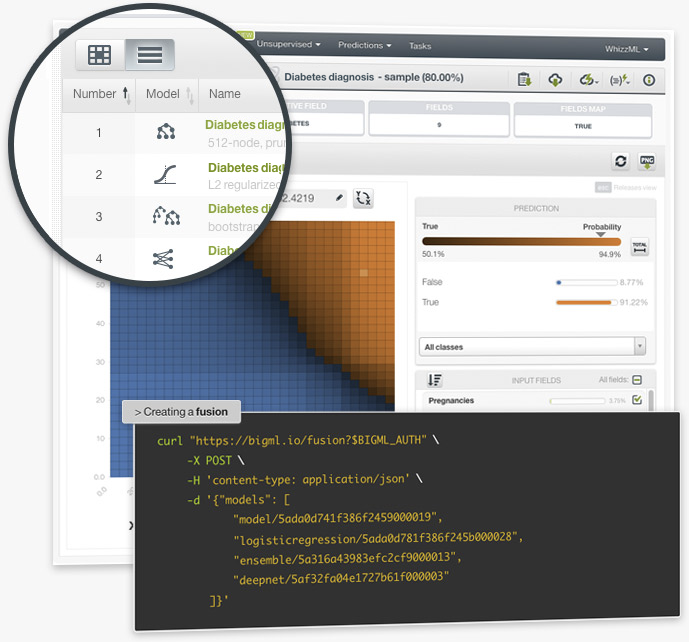
BigML is releasing Fusions, the new way to combine supervised models for improved performance. BigML Fusions combine multiple decision trees, ensembles, logistic regressions, and/or deepnets and aggregate their predictions to balance out the individual weaknesses of the single models for better performance and stability. Fusions are based on the assumption that the combination of multiple models often outperforms the component single models.
BigML provides a unique and intuitive visualization for Fusions: a Partial Dependence Plot for you to further inspect the Fusion results. Learn more about fusions here!
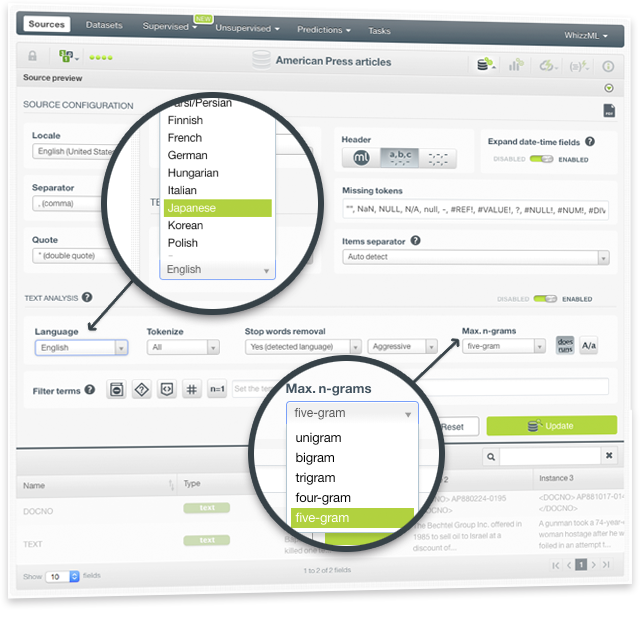
BigML is happy to announce new options to analyze your text fields. With the newly added capabilities, supervised and unsupervised models will be able to identify more patterns in your text data. The configuration options include:
- 15 new languages! BigML can now process text in 22 different languages: Arabic, Catalan, Chinese, Czech, Danish, Dutch, English, Farsi/Persian, Finish, French, German, Hungarian, Italian, Japanese, Korean, Polish, Portuguese, Turkish, Romanian, Russian, Spanish, and Swedish.
- The maximum n-gram size to consider for your text analysis: bigrams, trigrams, four-grams and five-grams.
- New stop words removal techniques like the ability to remove stop words for all languages and the degree of aggressiveness for stopword removal.
- Stemming for the new languages.
- Filters to exclude certain groups of uninteresting words from your models such as HTML keywords, non-dictionary words, numeric digits or non-language characters. You can also choose to exclude unigrams from your text and keep only n-grams that include more than one word.
You can configure these options from your source so they will be taken into account by all your models. Moreover, as you iterate your model, you can easily configure these options for your topic models regardless of your original source configuration.
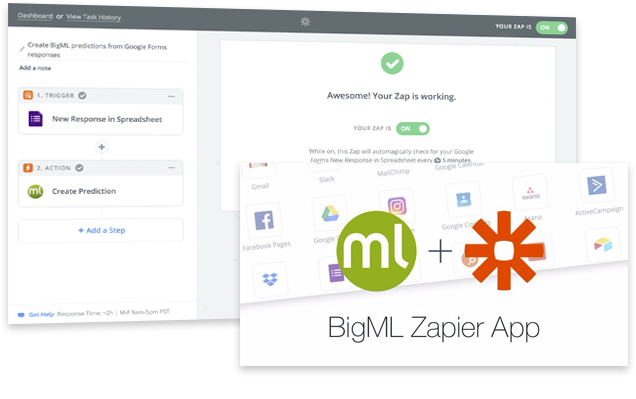
The BigML Zapier app allows you to easily automate your Machine Learning workflows without any coding. Import your data in real-time from the most popular web apps and the BigML app will automatically make predictions for you as your new data is being generated. Then you can simply choose which service or app you want to send the predictions to, and the BigML Zapier app will take care of integrating those predictions into your processes. See some workflow examples and try it for free today!
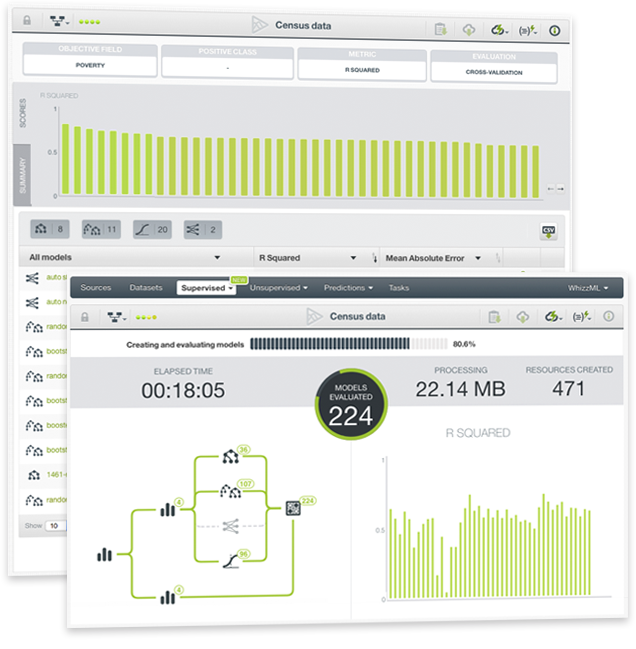
OptiML is an optimization process for model selection and parametrization that automatically finds the best supervised model to help you solve classification and regression problems.
Using Bayesian Parameter Optimization, OptiML creates and evaluates hundreds of supervised models (decision trees, ensembles, logistic regressions, and deepnets) and returns a list of the best models for your data. Eliminating the need for manual, trial-and-error based exploration of algorithms and parameters, OptiML saves significant time and provides improved performance for Machine Learning practitioners of all levels.
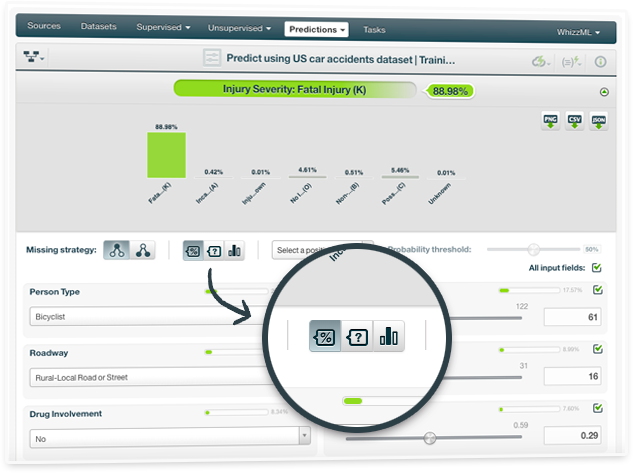
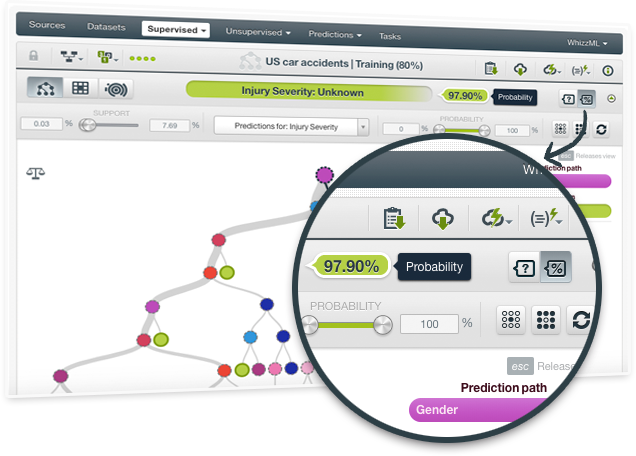
For any classification or regression model, you can now request an explanation for your predictions. The explanation represents the most important factors considered by the model in the prediction given the input values. Therefore, each input value will have an associated importance where the importances across all input values sum up to 100%.
While the prediction explanation for decision tree models is calculated using the prediction path, for other models (ensembles, logistic regression, and deepnets) the prediction explanation is calculated by aggregating the results of over a thousand distinct predictions that use random perturbations of the input data.
To read more about the prediction explanation with the BigML Dashboard please read the sections "Prediction Explanation" of the Classification and Regression document. To get the prediction explanation with the BigML API you need to use the "explain":true argument as detailed in API documentation.
The BigML Team is excited to release the BigML Dashboard in Chinese. Since its very beginning, BigML has strived to make Machine Learning Beautifully Simple for Everyone (机器学习美观简单人人用). Today our journey reached another milestone by allowing over 1 billion people to use the BigML platform in their native language.
You can watch this video to check out the BigML Dashboard in Chinese
Machine Learning projects usually involve several members from different teams that need to work on the same project and/or visualize the same resources. Now, BigML offers organizations, a convenient collaborative workspace that makes your life easier and your work more efficient, where several users can work on the same projects from different accounts at different permission levels. Break down silos and let us help you to adopt Machine Learning across your entire corporate structure.
Create a new organization or learn more about it.
As you may know, ensembles are composed of several decision trees. For non-boosted ensembles, each single tree returns a prediction given the input data. These predictions need to be combined so the ensemble returns a single prediction for each new instance.
For the previous years, BigML has been offering what we called "combiners": plurality, confidence weighted and probability weighted. Each of them provided a different strategy to combine single tree predictions. Now BigML is improving these strategies for ensembles and homogenizing the predictions across all resources, offering three new options that will replace our old combiners forever:
- Probabilities: Averages the per-class probability distributions for all trees in the ensemble and predicts the class with the highest probability. For regression ensembles, the global prediction is the mean of the individual predictions.
- Confidences: Averages the per-class confidence distributions for all trees in the ensemble and predicts the class with the highest confidence. For regression ensembles, the global prediction is the mean of the individual predictions weighted by the expected error.
- Votes: Gives one vote to each model in the ensemble. For classification models, the category with the majority of votes wins. For regression models, the global prediction is the mean of the individual predictions (it gives the same results as the probability strategy).
You can find these new options among the prediction arguments in the BigML API under the name of operating_kinds. The old combiners will also still be available from the API for a while.
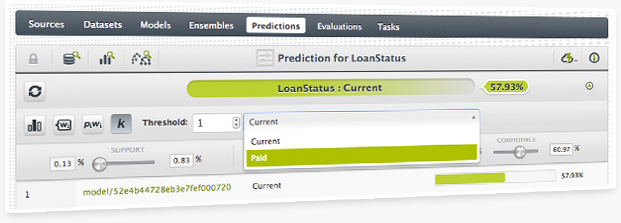
Set a threshold for the positive class when creating single predictions for any classification model. This technique is very useful for imbalanced datasets where one or a few classes are the majority classes. In these cases, models tend to predict the majority classes at the expense of the minority class that is usually the class of interest (called the positive class).
By setting a threshold for the positive class, this class will be predicted if its probability (confidence or votes depending on the type of measure you select) is greater than the established threshold, otherwise the following class with the highest probability (confidence or votes) will be predicted instead.
Whether you build a single decision tree, an ensemble, a logistic regression or a deepnet, you can select a positive class and set a threshold for a given prediction.
BigML has been always using confidences (a pessimistic approach) to measure the certainty of a given prediction. Now you can decide to also see probabilities for model predictions. The fundamental difference between both measures is that probabilities don't penalize a lower number of instances in a given node so heavily.
You can see how the three different model visualizations change by playing with the buttons to show confidences or probabilities at the top of the model view.
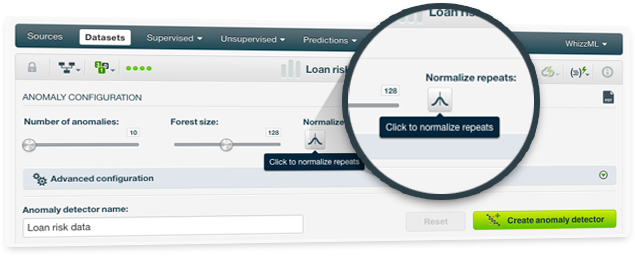
Improve the anomalies found in your dataset using the new parameter "Normalize repeats". If you enable this parameter, Anomalies will take into account not only the different values but also the frequency of repeated (or very similar) data points.
For example, if you had many missing values in your data, it may happened that the Anomaly detector identified the instances with missing values as highly anomalous regardless whether missing values were the rule instead of the exception. By using "Normalize repeats", instances with missing data will not appear among the top anomalies in this case.
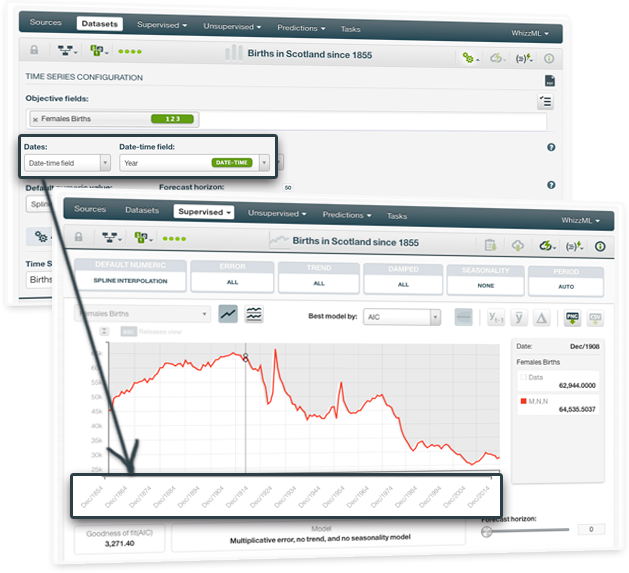
You can now select the date-time field from the dataset to plot your time series data in the Dashboard. Be aware that your instances must be chronologically sorted in the dataset to select the date-time field.
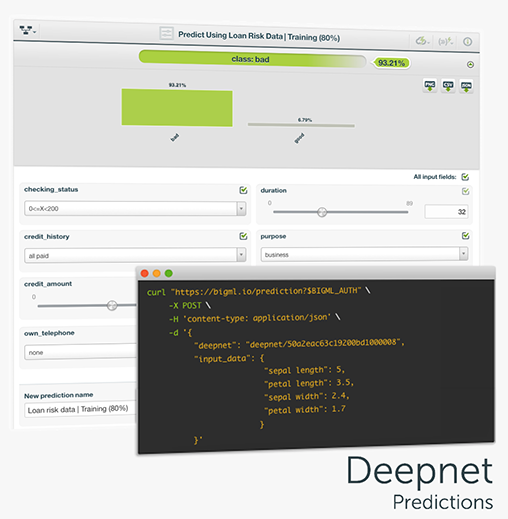
One of the main goals of any BigML resource is making predictions, and Deepnets are no exception. Deepnets can be used to predict categorical or numeric values. As Deepnets have more than one layer of nodes between the input and the output layers, the output will be the network’s prediction. In the case of categorical objective fields, an array of per-class probabilities will be returned, while a single, real value will be predicted for regression problems. You can perform single predictions, if you want to predict just one instance; or batch predictions if you want to predict multiple instances at the same time.
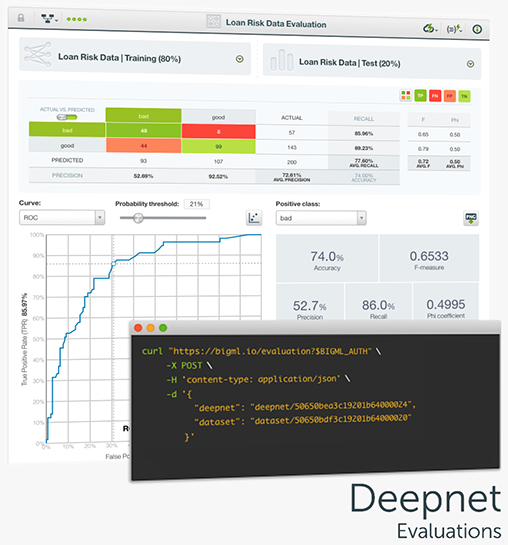
Evaluate the performance of your Deepnets to get an estimate of how good your model will be at making predictions for new data and easily interpret the results with BigML evaluation visualizations. As with other supervised learning models on BigML, Deepnets include the confusion matrix and the ROC and Precision-Recall curves to help you solve classification problems. Furthermore, quickly compare the performance of your different Deepnets and other models built using different algorithms with the BigML evaluation comparison tool.
BigML is proud to announce Deepnets, an optimized version of Deep Neural Networks, the machine-learned models loosely inspired by the neural circuitry of the human brain. Deepnets are state-of-the-art in many important supervised learning applications. To avoid the difficult and time-consuming work of hand-tuning the algorithm, BigML’s unique implementation of Deep Neural Networks offers first-class support for automatic network search and parameter optimization. BigML makes it easier for you by searching over all possible networks for your dataset and returning the best network found to solve your problem. Thus, non-experts can train deep learning models with results matching that of top-level data scientists.
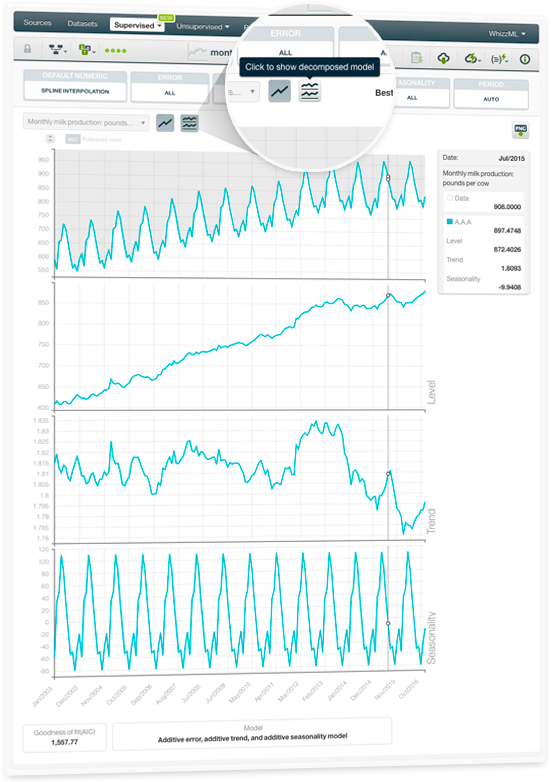
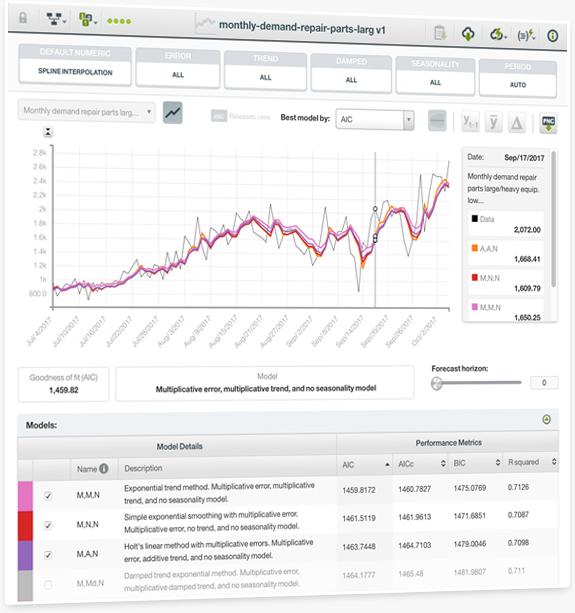
BigML recently launched Time Series, a sequentially indexed representation of your historical data commonly used for predicting stock prices, sales forecasting; website traffic, production, and inventory analysis as well as weather forecasting among other use cases.
BigML implements exponential smoothing methods which are able to learn multiple models out of the training data by using different combinations of the three essential model components: the level, the trend, and the seasonality. Now, you can decompose your models to display each of these components plotted in a separate chart. For a detailed explanation of each component, please visit the dedicated release page, where you will find a series of six blog posts about Time Series, the BigML Dashboard and API documentation, the webinar slideshow as well as the full webinar recording.
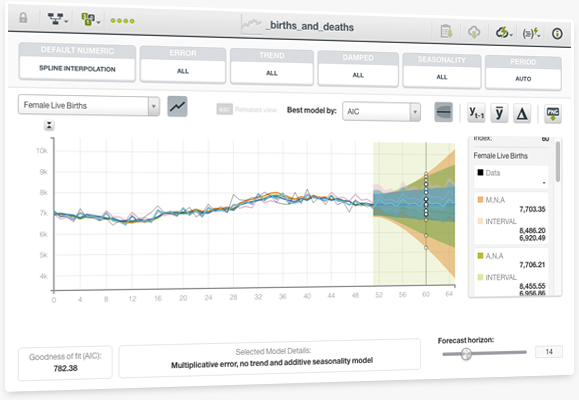
You can use your Time Series models to make predictions, which are called Forecasts. With Time Series Forecasts, you can easily forecast events in short or longer time horizons. You can also employ a Time Series model to forecast the future values of multiple objective fields. Along with each forecasted data point, BigML generates an error interval as a measure of the quality of your forecast. The interval indicates the lower and upper bounds within which the forecast will fall with a 95% confidence.
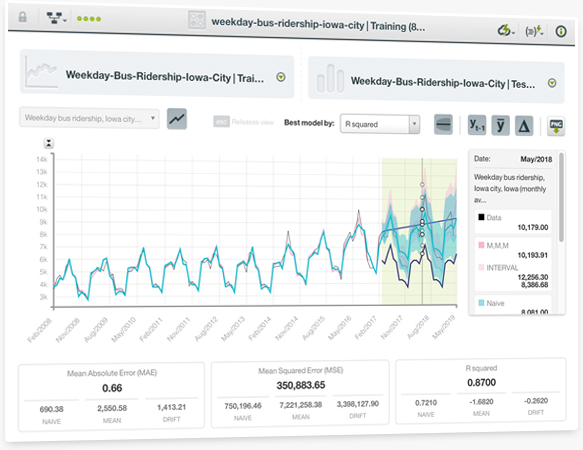
You can easily evaluate the performance of your Time Series models. For this, you need to use two different subsets of data: one for training and the other one for testing. BigML represents your test data and the model forecasts in a chart, so you can visually analyze the goodness-of-fit of your Time Series models.
You will also see multiple performance metrics such as the Mean Absolute Error (MAE), the Mean Squared Error (MSE), the R squared, the Symmetric Mean Absolute Percentage Error (SMAPE), the Mean Scaled Error (MSE), and the Mean Directional Accuracy (MDA). You can find an explanation for each metric in the 6th chapter of the Time Series documentation.
BigML is proud to launch Time Series, a sequentially indexed representation of your historical data that can be used to forecast future values of numerical properties. This is a versatile method often used for predicting stock prices, sales forecasting, website traffic, production and inventory analysis, and weather forecasting, among many other use cases.
A Time Series model needs to be trained with numeric fields containing a time-ordered sequence of regularly spaced data points in time. BigML implements exponential smoothing methods which are able to forecast time-based data with complex trends and seasonal patterns. BigML generates multiple models behind the scenes so you can select the best-performing ones. You can find a detailed explanation in the Time Series documentation.
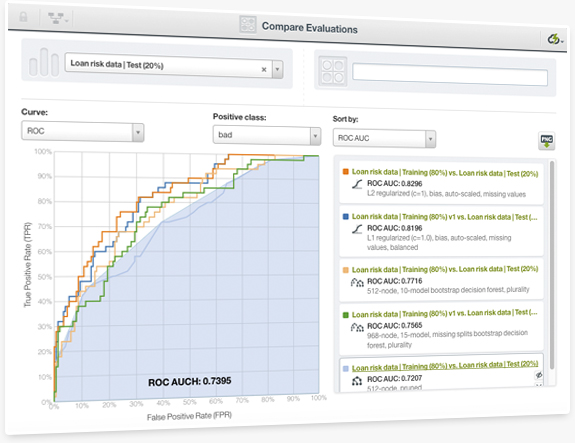
Any classification problem can be solved by using different supervised learning algorithms and using different configurations per algorithm as you iteratively improve your models. BigML brings to the Dashboard an easy and visual way to compare your models and decide which one performs better. You can easily select the models, the positive class, the metrics and any of the ROC curve, the precision-recall curve, the gain curve, or the lift curve for your comparison. You can also rank your models by the Area Under the Curve (AUC), K-S statistic, Kendall's Tau, or Spearman's Rho.
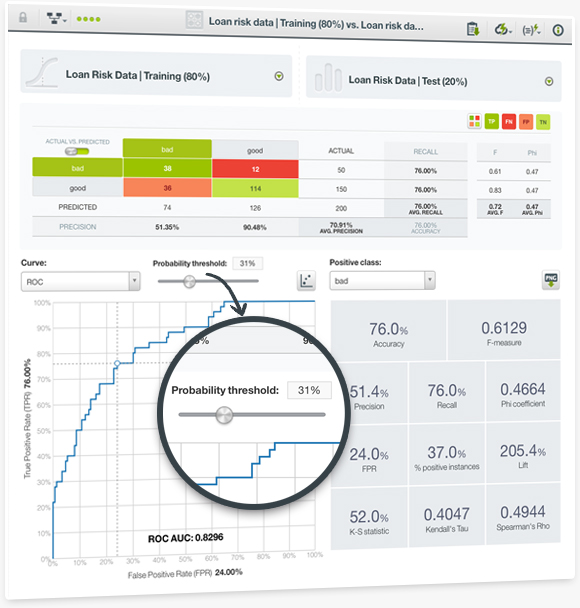
Evaluating the performance of your Machine Learning models is one of the most important steps in the predictive process. BigML is releasing a new Dashboard visualization for evaluations, which includes new performance metrics to make it easier to assess the performance of your classification models. Now, you can use the popular ROC curve to understand the trade-off between sensitivity and specificity for each possible threshold as well as the precision-recall curve, the gain curve, and the lift curve. Moreover, you can find new metrics that measure the overall predictive performance of your models for the selected positive class such as the Area Under the Curve (AUC), the Area Under the Convex Hull (AUCH), the K-S statistic, the Kendall's Tau, and the Spearman's Rho coefficients.
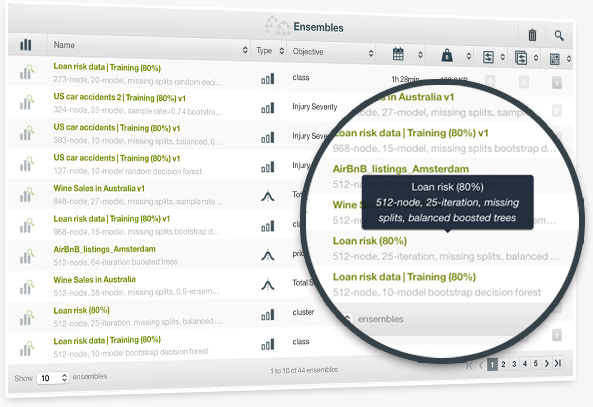
To solve Machine Learning problems, you usually need several iterations that employ different algorithms and configurations to build your final models and workflows. Now, BigML makes it even easier and faster for you to find the right resources at a glance from among many that belong to the same project by listing the values of your configured parameters for each resource.
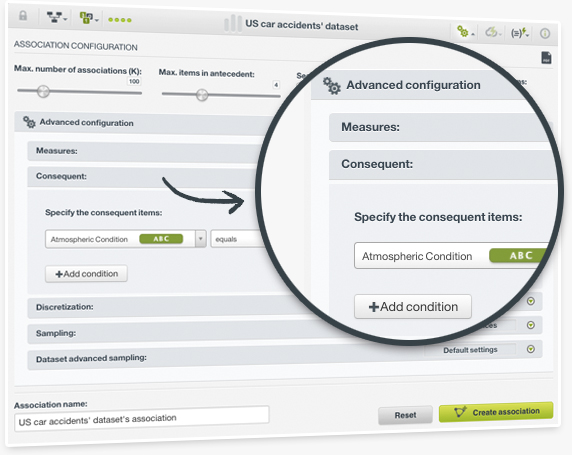
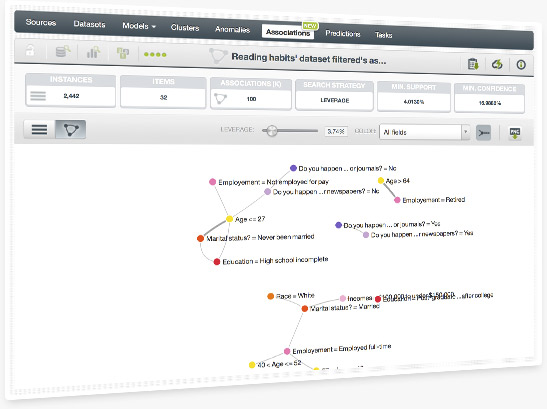
Associations are powerful means in finding strong correlations among your dataset values. However, depending on your case, you may not always be interested in finding the strongest relationships but only the rules that meet certain conditions instead. Specifying your conditions to zero in on your rules of interest is now easier than ever. Simply select your data field of interest and one or more field values for the consequent part of the rule, and you will obtain the relevant associations in no time.
The ultimate goal of creating any supervised learning model is to get a prediction for new intstances. Like other supervised models, Boosted Trees offer Single Predictions to predict a given single instance and Batch Predictions to predict multiple instances simultaneously. Instead of returning a single class along with its confidence, Boosted Trees return a set of probabilities for all the classes in the objective field which is visible in the predictions histogram.
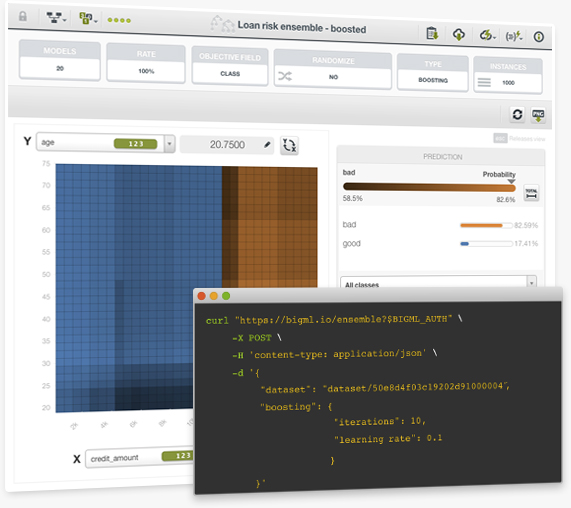
The BigML team is proud to announce Boosted Trees, the third ensemble-based strategy that BigML provides to help you easily solve your classification and regression problems. Together with Bagging and Random Decision Forests, Boosted Trees make for a powerful combination available both via the BigML Dashboard and our REST API. This well-known technique is an ensemble of several single models, where each tree improves the mistakes made by the previously grown tree. It is one of the best performing Machine Learning methods to solve complex real-world problems.
As a complement to our popular decision trees visualization and the sunburst, we are launching a third view for your models: the Partial Dependence Plot. This heatmap chart also allows you to analyze the marginal impact of each input field on predictions for classification and regression models built by using ensembles and logistic regressions.
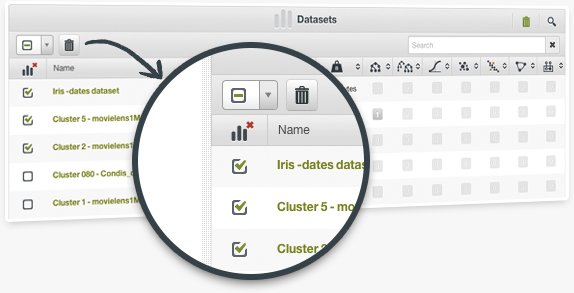
Solving a Machine Learning problem is an iterative process that requires the creation of a great number of intermediary datasets, models, evaluations and predictions to get the final model. Now, BigML simplifies it keeping your account organized and up-to-date by allowing the deletion of multiple resources at the same time. Just click the deletion icon found in the resources listing in the Dashboard, and select the resources to be deleted.
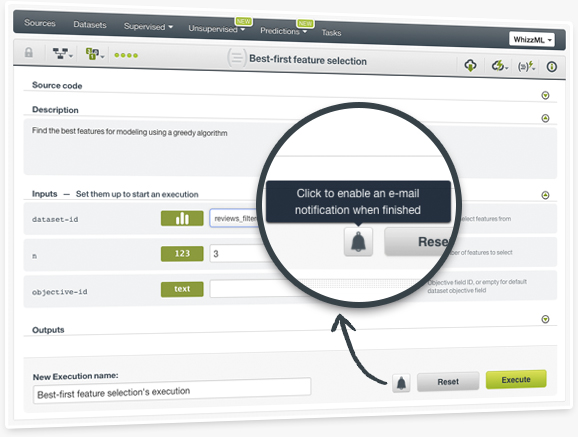
Asynchcronous WhizzML script executions can take some time to finish to fulfill complex Machine Learning workflows they implement. You no longer need to check your execution repeatedly to see if your results are ready. This new option let's you specify that you want to be notified by e-mail once the execution finishes, while you concentrate on other tasks.
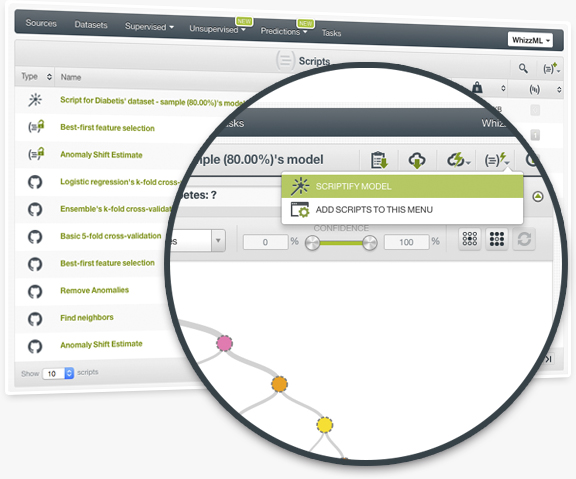
Furthering our obsession to speed up your Machine Learning processes, we have incorporated Scriptify into your 1-click menu options. Now, you can automatically regenerate any BigML resource (models, evaluations, predictions, etc) with a single click. Scriptify creates a script that contains all the workflow information end-to-end (from configuration parameters to resources created). You can precisely repeat the processing steps of any original Machine Learning resource to your heart's desire!
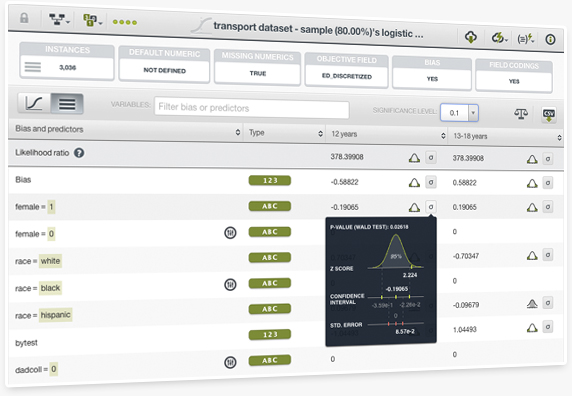
These new Dashboard statistics allow you to introspect the predictive power of your model by revealing the significance of each coefficient estimate. BigML computes the likelihood ratio to test how well the model fits your data along with the p-value, confidence interval, standard, error and Z score for each coefficient.
Learn more about the Logistic Regression statistics in the Dashboard documentation.
Now, you can easily clone datasets, models and scripts, from other users into your BigML account. Provided that a user shares a resource using the sharing link and the cloning capability is enabled, any other user with access to the link will be able to include this resource in their BigML account.
This new feature will allow you to fully use the shared resources. For example, when another user shares a dataset using the sharing link, it is in "view only" mode, so you can not perform any actions such as creating new models, exporting it, sampling it, etc. Now, by cloning it, you will be able to perform all BigML actions available for datasets.
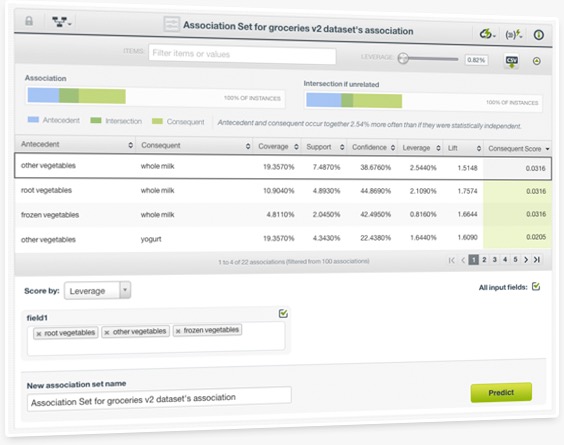
BigML is bringing predictions for Associations to the Dashboard. Association Sets allow you to pinpoint the items which are most strongly associated with your input data. For example, given a set of products purchased by a person, what other products are most likely to be bought?
All the predicted items will be ranked according to a similarity score, and they will be displayed in a table view. You can also visualize each predicted rule in a Venn diagram to get a sense of the correlation strength between the input data and the predicted items. Read more about Association Sets in the 8th chapter of the Associations documentation.
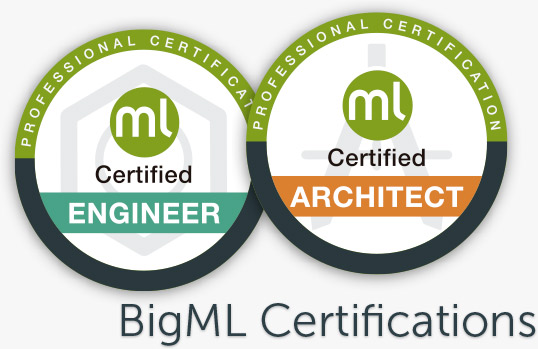
We are happy to announce BigML Certifications, for organizations and professionals that want to master BigML to successfully deliver real-life Machine Learning projects. These courses are ideal for software developers, system integrators, analysts, or scientists, to boost their skill set and deliver sophisticated data-driven solutions. We offer two separate courses, each of them consisting of 4 weekly online classes of 3 hours each:
-
Certified Engineer: all you need to know about advanced modeling, advanced data transformations, and how to use the BigML API (and its wrappers) in combination with WhizzML to build and automate your Machine Learning workflows.
-
Certified Architect: learn how to implement your Machine Learning solutions so they are scalable, impactful, capable of being integrated with third-party systems, and easy to maintain and retrain.
If you successfully pass the certification exam, BigML will award you with a diploma. In addition, BigML Certified Partners will receive business referrals that help them source new Machine Learning projects.
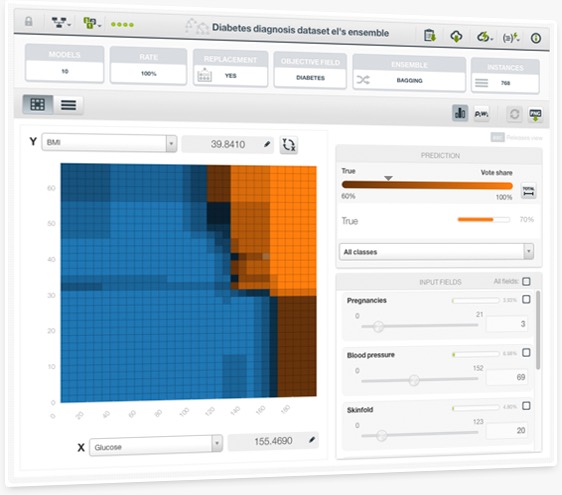
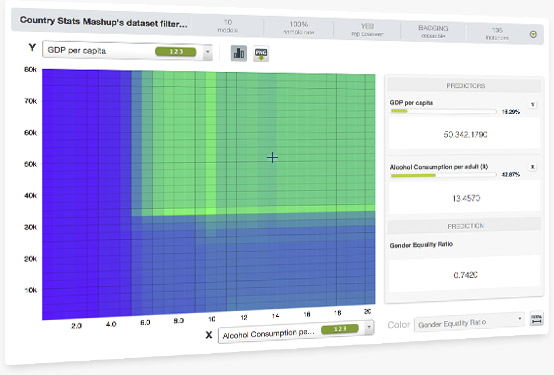
This new visualization for ensembles, commonly known as Partial Dependence Plot, allows you to visualize the impact that a set of fields have on predictions. You will be able to determine which fields are most relevant for ensemble predictions and how sensitive your ensemble predictions are to their different values.
The chart displays a heatmap representation of your predictions based on different values of the two selected fields in the axes regardless of the rest of the fields used to train your ensemble. You can select any categorical or numeric field for the axes and configure the values for the rest of the input fields by using the fields inspector panel on the right.
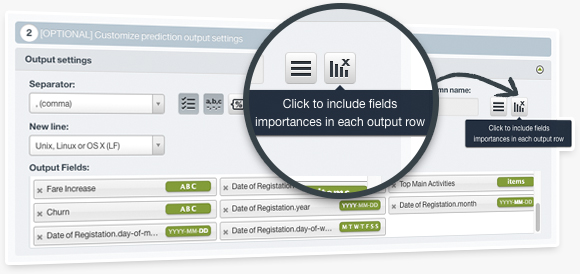
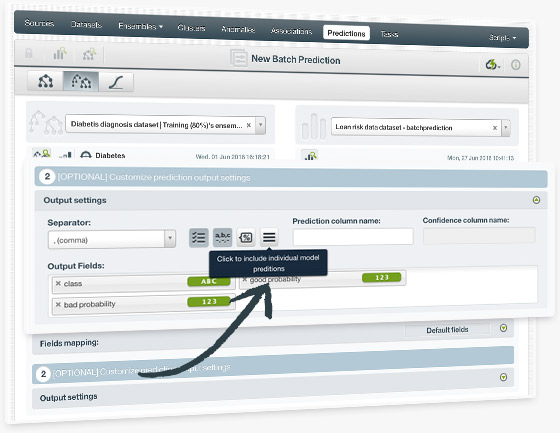
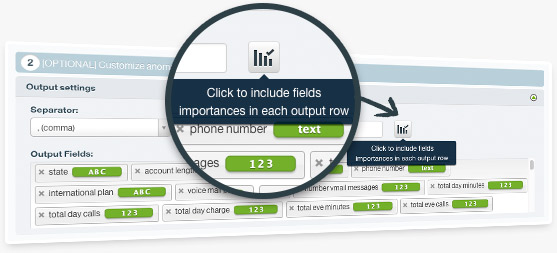
This feature enables you to include the field importances in your batch predictions, i.e., a set of percentages indicating how much each field in your dataset contributed to the prediction of a given instance. You can include those values in your output file and dataset either with BigML Dashboard or the API. This will give you a better understanding of your predictions as it will reveal which are the most relevant fields factoring in a given prediction.
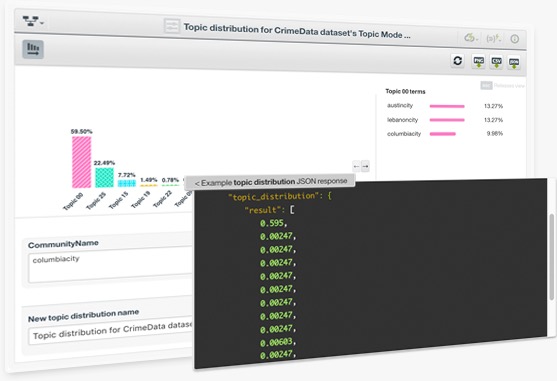
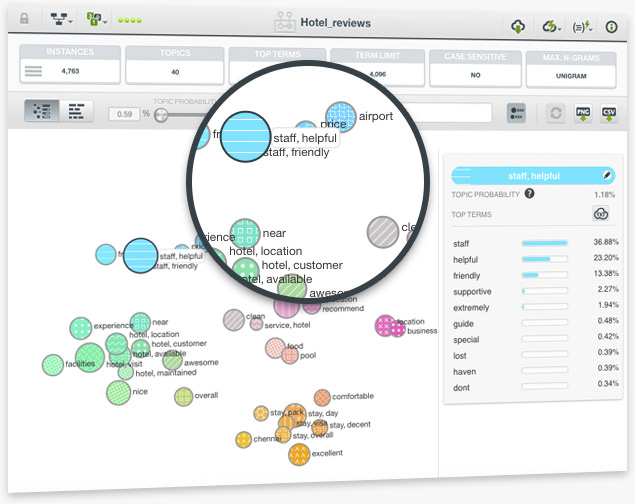
Topic Models assume that each document exhibits a mixture of topics. The main goal of creating a Topic Model is to discover the topic importances for a given document. For example, a document may be 70% about "Machine Learning", 20% about "stock market" and 10% about "startups".
Topic Distributions allow you to make predictions for a single data instance, and Batch Topic Distributions help predict the same for multiple instances simultaneously. Based on a given Topic Model, BigML Topic Distributions provide a set of probabilities for each data instance (one probability per topic), which indicate the relative relevance of all topics for that instance.
Learn more about Topic Models here
The BigML team has brought Topic Models to the API and the Dashboard as part of the Fall 2016 release. Topic Models are an optimized implementation of Latent Dirichlet Allocation, a probabilistic unsupervised learning method that determines the topics underlying a collection of documents.
Topic Models' main application areas include browsing, organizing and understanding large amounts of unstructured text data, which can be very useful for information retrieval tasks, collaborative filtering or content recommendation use cases among others.
BigML provides two original visualizations that accompany its implementation so you can better inspect your Topic Model:
- Topic Map: get an overview of your topic importances and their thematic closeness.
- Term Chart: get an overview of the main terms that make up your found topics.
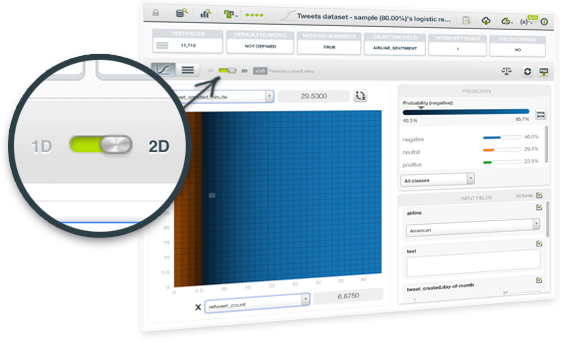
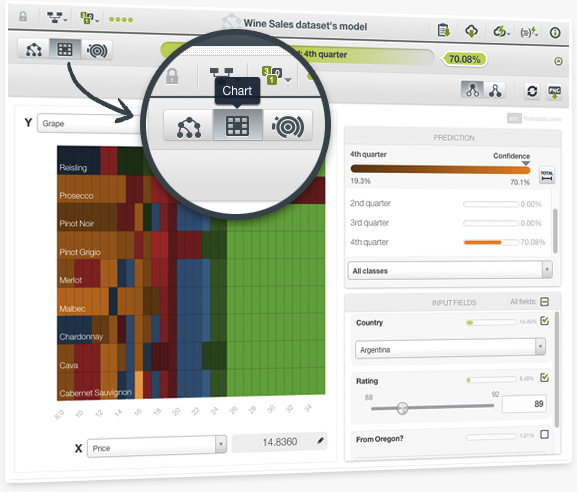
BigML has released the 2D chart for Logistic Regression for you to analyze the impact of two input fields on predictions simultaneously. This view complements the current 1D chart for Logistic Regression. Just select any categorical or numeric field for the axis and the objective class probabilities will be automatically displayed in the heat map chart. You can also configure the rest of input field values using the fields form to the right. To learn more about Logistic Regression, see our Summer 2016 release.
Ease your WhizzML coding with syntax highlighting and auto-completion using the Sublime Text package. If you are a WhizzMLer and a Sublime Text fan, you will love this new package. Install it via Package Control.
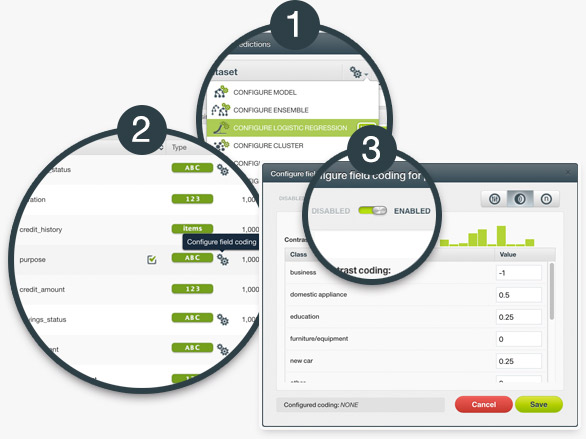
Logistic regression needs numeric variables as input data. In order to support categorical fields, BigML transforms them by using one-hot coding, i.e., mapping to binary values (0s and 1s only). With Field Codings you can encode your categorical fields using three different strategies: dummy coding, contrast coding and other coding. Learn more about the three options in the Dashboard documentation.
Include all the individual trees predictions within the ensemble when creating a batch prediction. You can also include the confidence or expected error for each individual prediction by enabling the confidence option for the output file. This information will provide you a deeper understanding of the ensemble predictions and a flexible way to compute your preferred prediction combination.
After bringing logistic regression to the API, it is now available in your Dashboard.
BigML is one of very few Machine Learning platforms offering a logistic regression visualization, which includes a twofold view: a chart and a coefficients table. The logistic regression chart provides a visual way to analyze the impact of your input fields on predictions. The table shows all the coefficients learned for each of the logistic function variables, which is ideal for inspecting model results and debugging tasks.
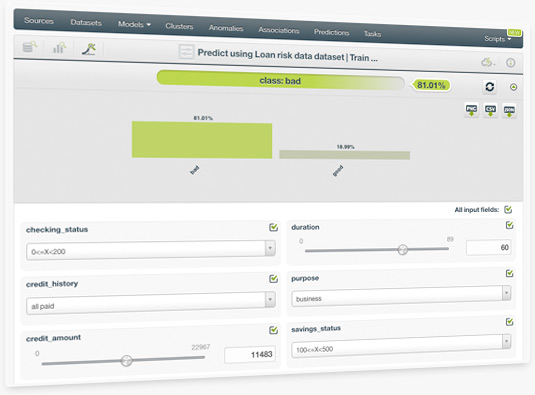
The ultimate goal of creating a logistic regression is to make predictions with it. Easily predict single instances using BigML prediction form —just input the values for the fields used by the logistic regression. You will get the predicted class along with its probability at the top of the view.
BigML also provides all classes probabilities in a visual histogram that changes real-time when you configure the input field values.
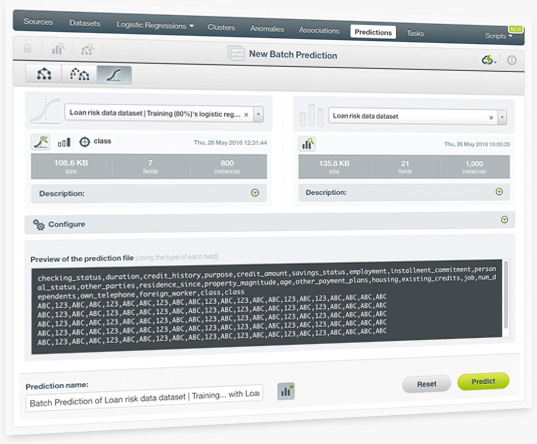
BigML batch predictions allow you to predict multiple instances with one-click. Just select the logistic regression and the dataset containing the data you want to predict, and BigML will automatically generate an output CSV file with a prediction for each of your instances.
You can also configure a wide range of the output file settings, e.g. you can include all the objective field classes probabilities for each of the instances in your dataset.
BigML is proud to announce WhizzML, a new domain-specific language for automating Machine Learning workflows and implementing high-level algorithms.
WhizzML abstracts away the complexity of the underlying infrastructure and offers out-of-the-box scalability. With WhizzML you can easily transform time-consuming repetitive tasks into 1-click actions or into a single API call. WhizzML provides a standardized way to implement high-level Machine Learning algorithms on your own, e.g. Gradient Boosting or Stacked Generalization.
You can also clone many advanced workflows and algorithms from WhizzML Gallery and share yours with others!
This feature enables you to include a set of percentages indicating how much each field in your dataset contributed to a given anomaly score when creating a Batch Anomaly Score. You can include those values in your output file either with BigML Dashboard or the API. This will give you a better understanding of your anomalous instances as it will reveal which factors are causing them to be seen as anomalous.
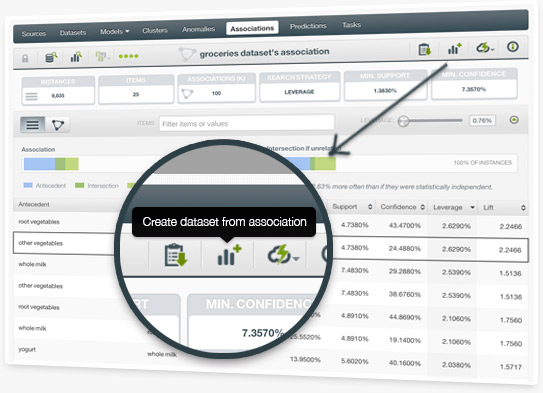
BigML associations let you discover meaningful relationships among dataset fields and their values. Now you can easily select the rules that you want from the list of associations found by BigML and create a filtered dataset from those. This allows you to conduct further analysis on the filtered dataset instances matching those association rules.
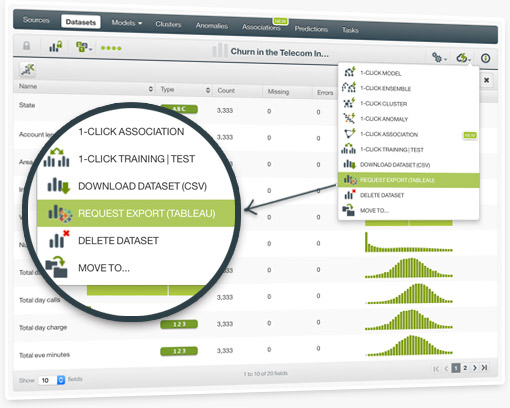
Many of you are already benefiting from the ability to incorporate and visualize your BigML models within Tableau. Now you can also export your datasets from BigML in .tde format with just 1-click. This enables you to visualize any BigML dataset (e.g., batch predictions, batch centroids, batch anomaly scores) within Tableau.
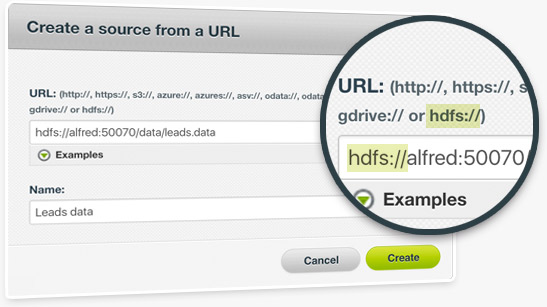
We are always on the lookout for new ways to help you use your remote data sources. With our new Hadoop integration you can upload new data to BigML directly from a Hadoop server by using a remote URL starting with "hdfs://", either from our Dashboard or our API.
BigML team has worked really hard to launch Association Discovery this Fall 2015. We are proud to be the first cloud-based platform that offers this unsupervised Machine Learning method to find meaningful relationships between values in high-dimensional datasets. BigML acquired Magnum Opus from professor Geoff Web (Monash University, Melbourne) combining the best-in-class Association Discovery technology with BigML easy-to-use platform.
Ensembles are one of the top performing algorithms for most Machine Learning problems, but they are also hard to interpret. Partial Dependence Plot (PDP) is a graphical representation of the ensamble that allows you to visualize the impact that a set of fields have on predictions. BigML provides a configurable two-way PDP where you can select the fields for both axis to analyze how they influence predictions. PDP can be used for regression and classification ensembles.
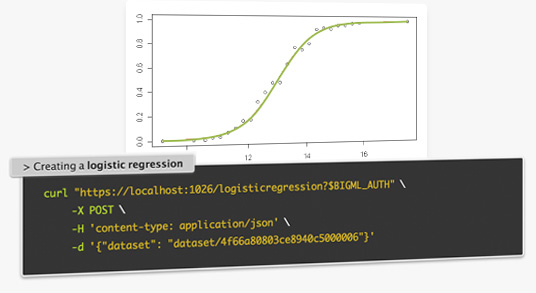
Logistic Regression is a supervised ML model to solve classification problems and it's now available in the API and BigMLer. It can be expressed according to the following formula:
y = 1 / {1 + e^[-logit(p)]}
where logit(p) = b_ 0 + b_ 1 * x_ 1 + ... + b_ k*x_ k
Each of the independent variables (x1, x2... xK) are the predictors of the model. Logistic regression seeks to learn the coefficient values (b0, b1, b2, ... bk) from the training data using non-linear optimization techniques and returns a probability for each of the predicted classes (y).
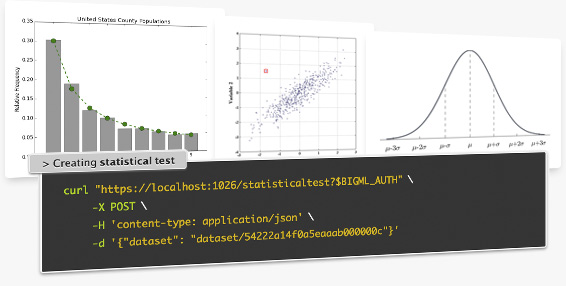
Use statistical techniques to explore your dataset fields. Common usages:
-
Fraud detection: by relying on Benford’s Law you can find symptoms of anomalous values in your dataset fields
-
Normality: find out whether the data in a field is normally distributed. Tests: Anderson-Darling, Jarque-Bera, Z-score.
-
Outliers: find out whether a field contains any value that differs significantly from the mean. Tests: Grubbs.
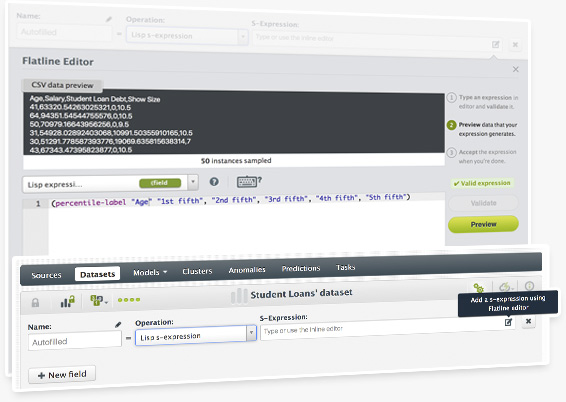
The Flatliner code editor is now available from the dataset configuration menu. You can use it to add more fields or to filter your dataset.
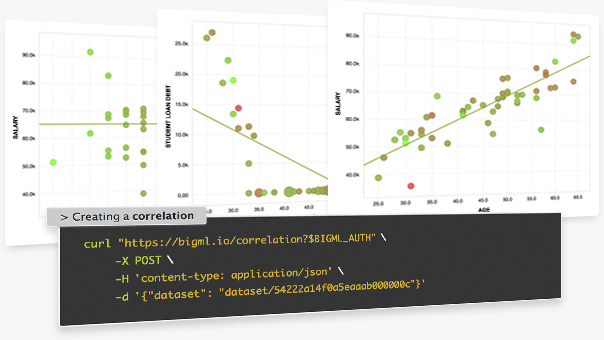
Find correlations between your dataset fields with this option available in the API. You just have to select a dataset and you will get some measures to detect the correlations between each of your dataset fields and the objective field. Correlations measures available:
-
Numeric-numeric fields: Pearson and Spearman coefficients
-
Numeric-categorical fields: one-way ANOVA (Eta-square, F-ratio)
-
Categorical - categorical fields: Contingency table, Chi-square, Cramer, Tschuprow
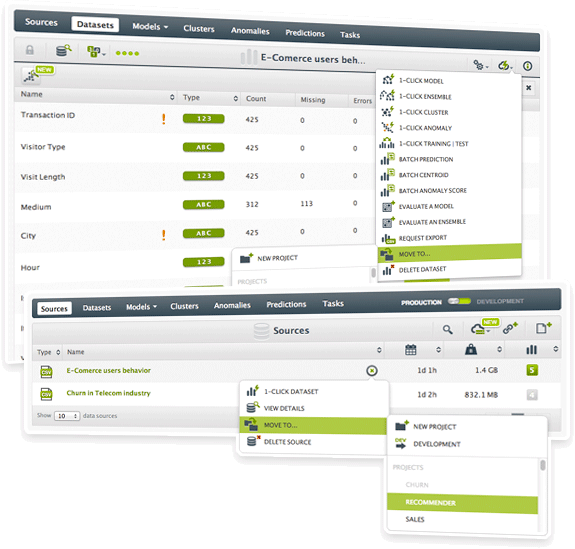
Now users can better organize their resources by moving them from one project to another. Sources can also be moved from production mode to development mode and the other way around.
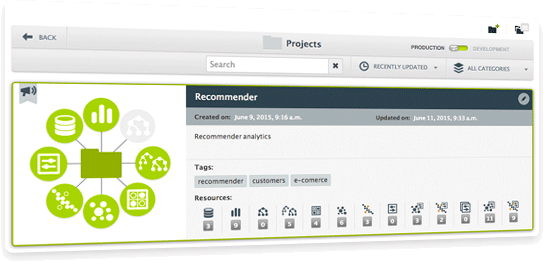
New view for Projects with built in search. Get a summary view of your projects in a single view.
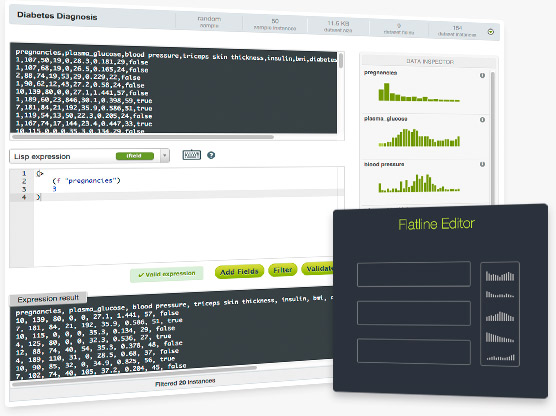
Flatline is BigML’s Lisp-like language that enables you to programmatically perform a vast array of data transformations, including filtering and new field generation. Our newest BigML Labs project Flatliner is a handy code editor that helps you visually test your Flatline expressions before you use them.
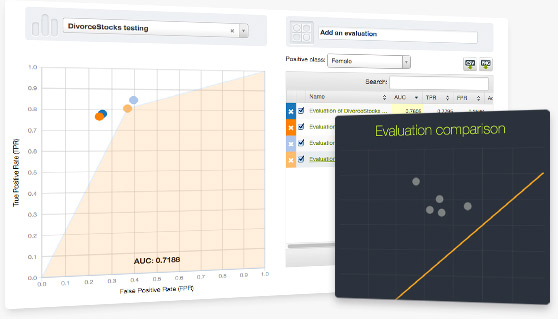
You can now compare multiple evaluations against a test set in a ROC space. The graph can then be downloaded as a .PNG image, and the performance measures can be exported as a .csv for further analyses.
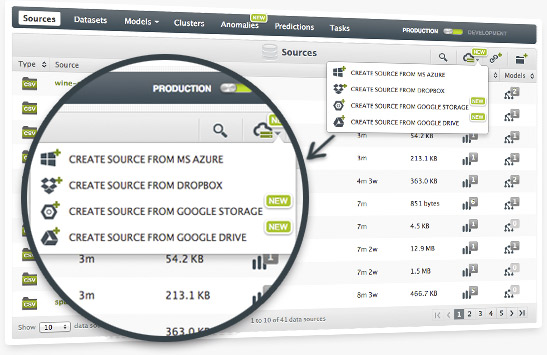
With the Winter Release, you'll now be able to add sources to BigML through Google Cloud Storage and Google Drive, similar to our prior integrations with Dropbox and Azure Data Marketplace. You can also now log into BigML using your Google ID.
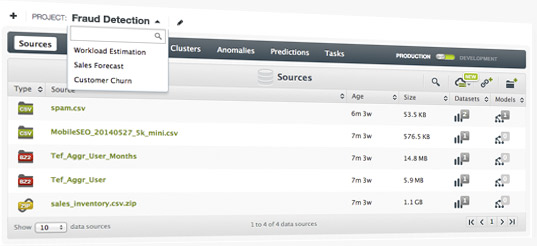
We're happy to introduce Projects to help you organize your machine learning resources. You only have to create a new project using the web interface or the API resource and update a new source to this project. All the new resources created from this source will be associated to the same project.
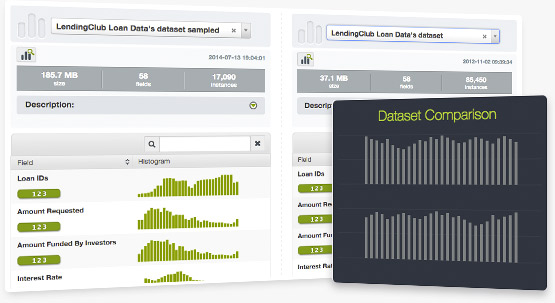
This is another simple but useful application we have released into our new BigML Labs. It allows users to compare side by side two different datasets. Check it out here.
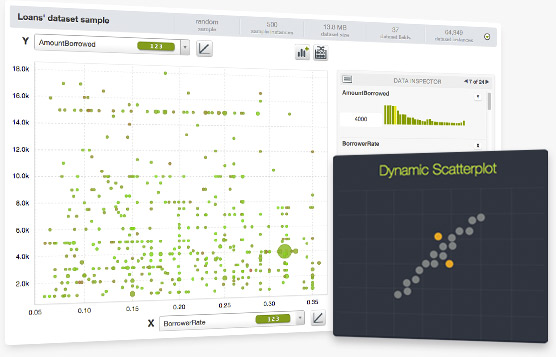
BigML's new Sample Service provides fast access to datasets that are kept in an in-memory cache which enables a variety of sampling, filtering and correlation techniques. We have leveraged this new service to create a Dynamic Scatterplot visualization that we've released into BigML Labs.
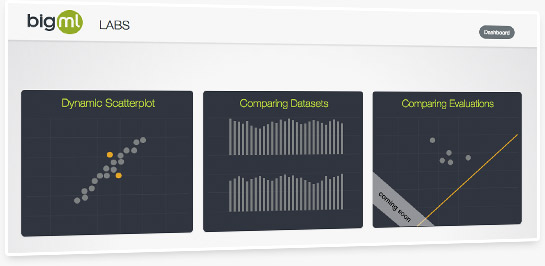
Our team is constantly working on innovative applications built on top of BigML's API. We're now unveiling several of these in early access through our BigML Labs.
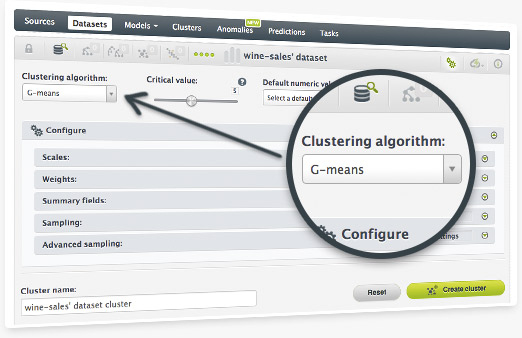
This latest addition to BigML's unsupervised learning algorithms is ideal for when you may not know how many clusters you wish to build from your dataset.
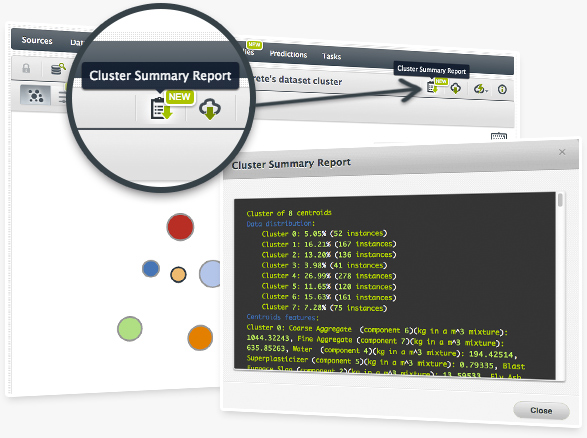
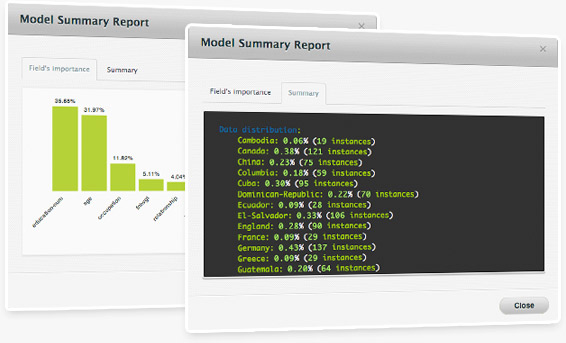
Now you can download a Summary Report for your BigML Clusters. This report will inform you on the distribution of data across your clusters, as well as the associated features and data distances.
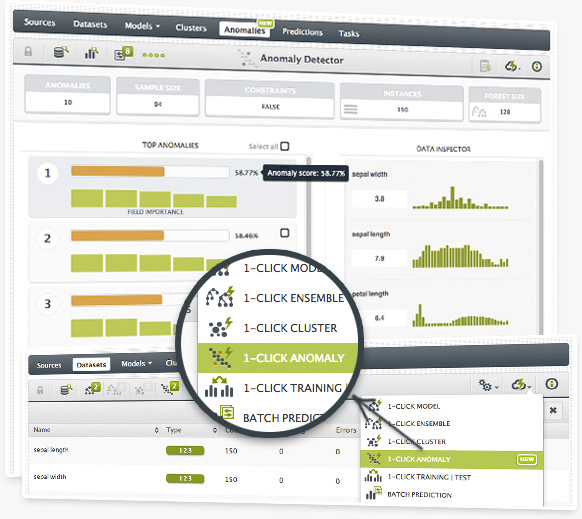
BigML makes it easy to build a top-performing anomaly detector that will help you identify instances in your dataset that do not conform to a regular pattern.
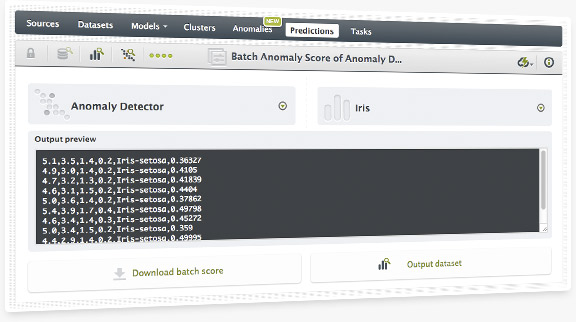
You can quickly score multiple lines of data through BigML's Batch Anomaly Score. The output can be downloaded as a .csv and/or you can use it to automatically create a new dataset.
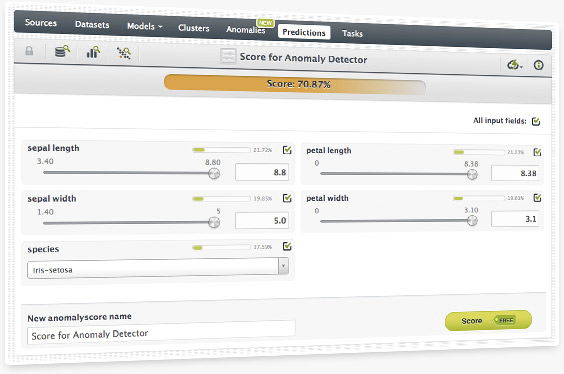
You can score individual data points against your anomaly detector by using the web interface. Simply input the variables and BigML will provide you with an anomaly percentage (a higher score reflects greater anomaly).
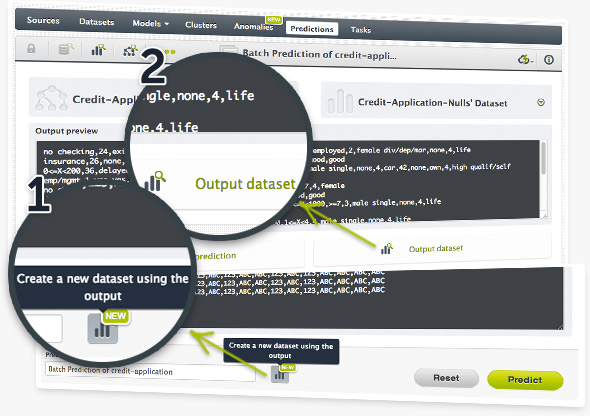
Batch predictions are a powerful way to score likely outcomes on multiple rows of data. You can now create a new dataset directly from the batch prediction output (in addition to getting the output as a .csv file).
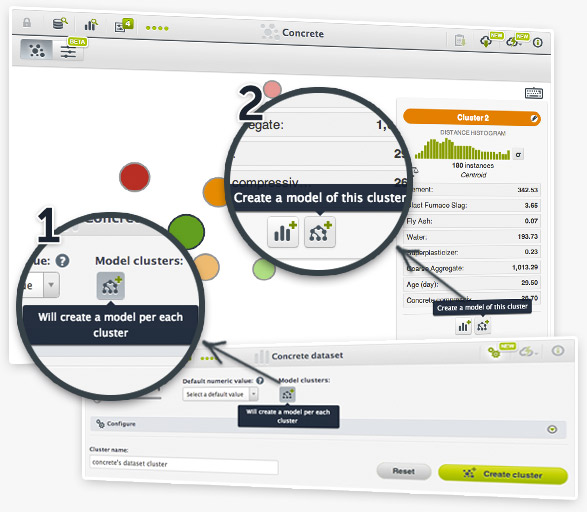
Now you can automatically create a model for each cluster that will not only help you better understand the cluster, but also use it to classify new instances.
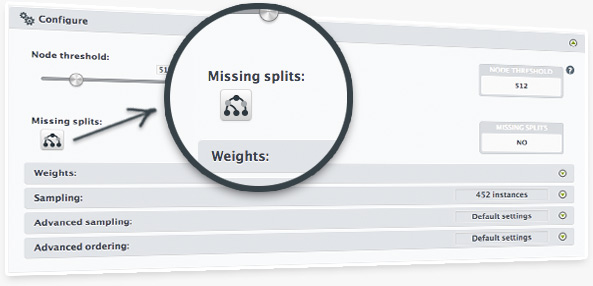
As we know that cleaning up data might be hard and having all the input data handy at prediction time is important, we have built a new option to create models that will generate predicates that explicitly deal with missing values.
New client-side predictions make it easier than ever to explore the influence of each field in your models, ensembles or clusters. In addition, we are open sourcing the related Javascript libraries so you can leverage this functionality to build very powerful and dynamic apps and web services.
We have refined the way the models of an ensemble are built to save a great amount of time in data transportation. This will dramatically speed up creation of your ensembles.
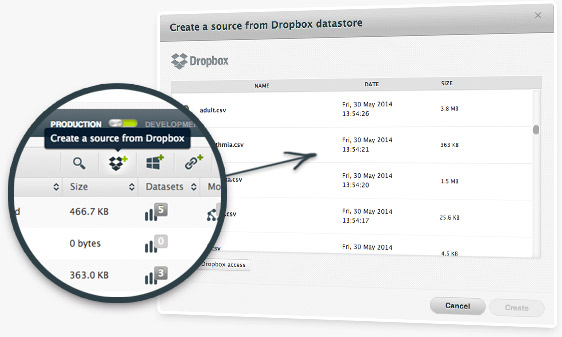
In another feature that we've created based on user demand, you can now use your Dropbox storage to bring new datasets to be analyzed in BigML. To activate this feature you have to visit the Cloud Storages section in your BigML account settings, and then allow BigML to access your Dropbox files. Note that BigML only reads your files for the purpose of downloading them into your Dashboard, and you can revoke the grant at any time in your account settings.
Once you've granted BigML access to your Dropbox account, you can browse your Dropbox account within BigML to identify sources that you’d like to download.
Based on user feedback, we've created a new Field Importance histogram that helps visualize these insights from the text in the Model/Ensemble Summary Report. You can access this new report for both your models and ensembles.
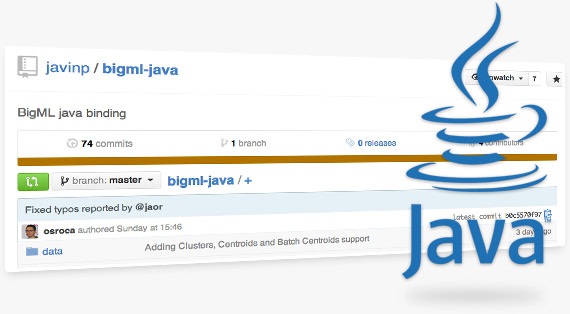
The Java BigML bindings have been updated with support for the new clustering analysis. Create new clusters, predict centroids and batch centroids using our REST API and Java. Clone or fork it from this GitHub repo.
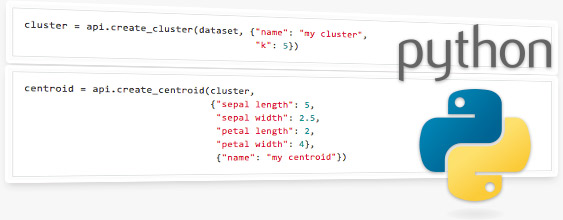
Do clustering analysis in python with the new version of the BigML Python bindings. We have added support for managing clusters, centroids, and batch centroids. Clone or fork them from GitHub.
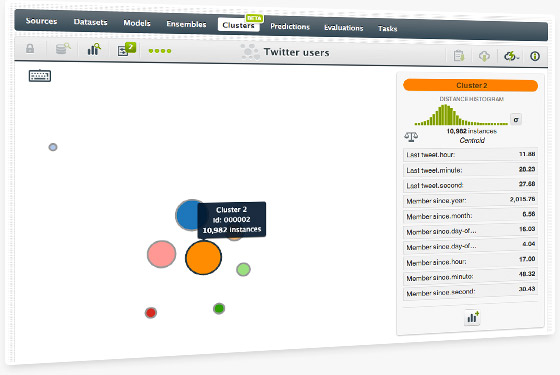
BigML's first unsupervied learning offering enables users to group the most similar instances from your dataset into Clusters. BigML's approach to Clustering is inspired by k-means and features the intuitive workflow and rich visualizations that you've come to expect from our service. Read more on this feature in our blog post.
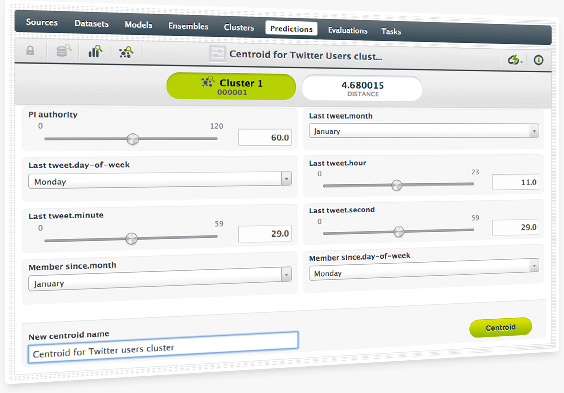
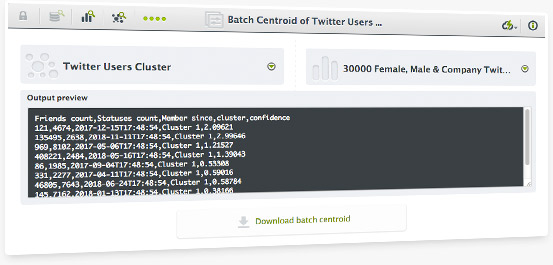
As we already do with batch predictions on models and ensembles, you can also compute centroids in batches using an existing cluster and a dataset. Predict the closest centroid of each instance of the selected dataset.
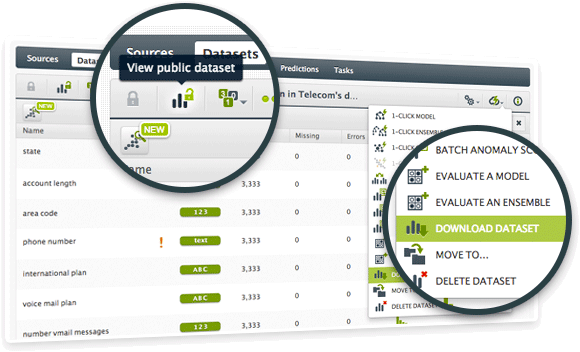
Now you can also export datasets from a dataset view into a comma-separated values (.CSV) file. This works very well in combination with the dataset creation from a model segment as it can help you identify the instances that follow certain criteria.
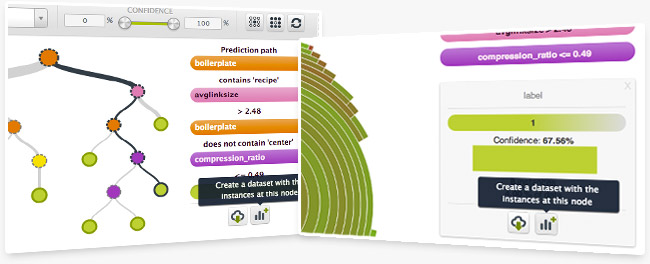
Have you ever wanted to create a new dataset for further analysis from a specific node in a tree? Now you can! When you're in a model or sunburst view, simply mouse over a node and then press your keyboard's shift button. This will freeze the view and allow you to export the rules for that segment and/or create a new dataset with the instances at that node.
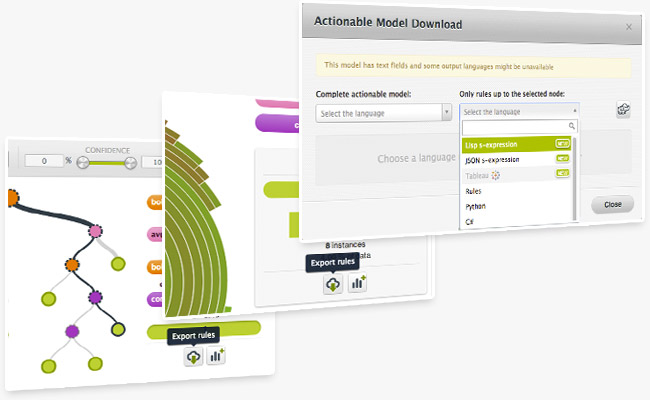
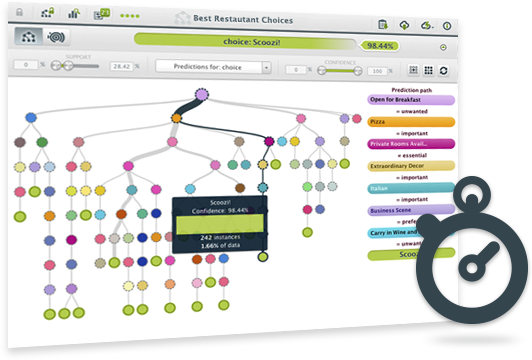
BigML's SunBurst visualization for decision trees is an intuitive, interactive way for users to experience data. Now you can include a fully interactive SunBurst viz in any web page simply by copying and pasting a snippet of HTML. Great for blog posts and news articles!
Read more about this feature in this blog post.
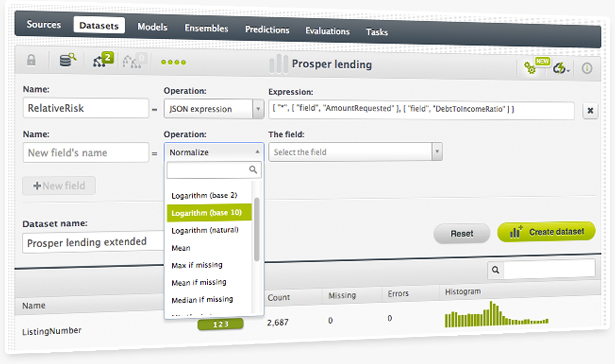
You can now add new fields to your dataset computed from existing features. There is a set of predefined generators and you can also define your own using our flatline expression language. This features is also available through the API.
There is a new way of combining predictions from models within an ensemble called k-threshold. With this combiner you can control the trade off between the precision and recall of your predictions and tune the risks you take when making predictions.
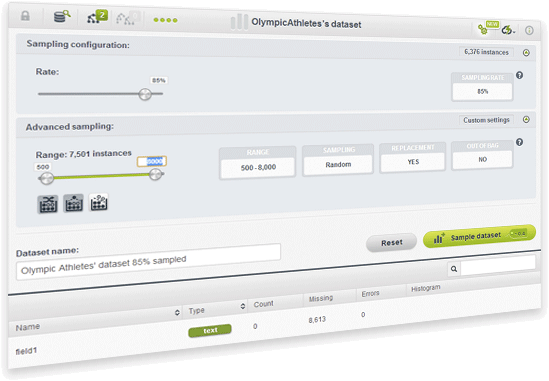
Have you ever wanted to create a new dataset from a sample of your original dataset? Now you can using different sample rates, different ranges of instances, choosing between random or deterministic samples, using replacement or not, or using out-of-the-bag samples.
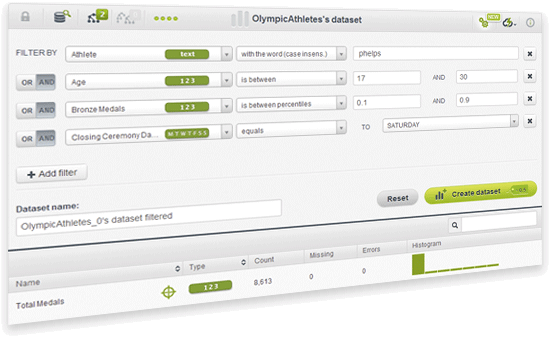
Have you ever wanted to create a new dataset to model a specific segment of your data? Now BigML comes with a simple but powerful way to create new datasets using combinations of filters on several fields of your dataset. This feature is even more powerful through the BigML API.
Increase the maximum number of nodes in your trees to boost their predictive power and improve the accuracy and confidence of their output.
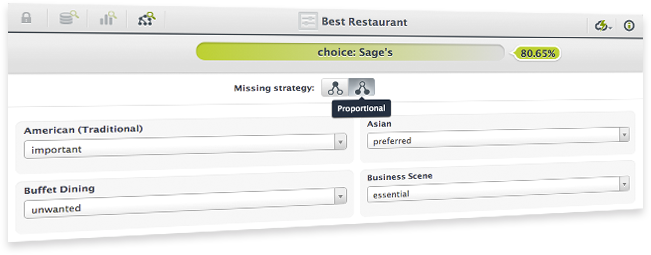
When making predictions with partial data you can now choose wether the algorithm should take into account unexplored tree branches to compute the final prediction (proportional strategy) or just stop at the given node (last prediction strategy).
Our new algorithm has significantly improved our performance when it comes to model building. Now you can build a model in 1/8 of the time it previously took.

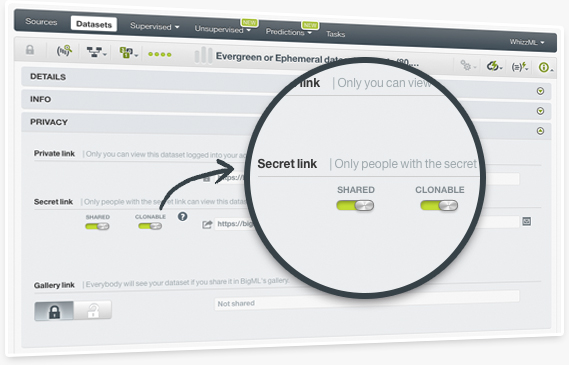
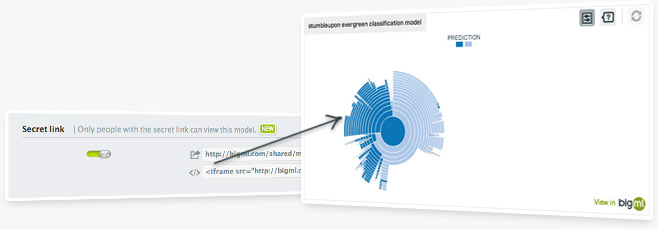
You can now share evaluations with co-workers or customers using secret links. Visit the evaluation that you want to share, click on the more info icon, open the privacy panel, and switch the secret link button. Anyone with the secret link will be able to access the evaluation.
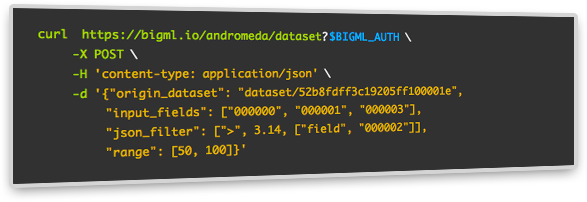
Need even more ways to transform your data? Now you can derive a new dataset by sampling, filtering, and even extending it with new fields, or concatenating it to other datasets.
In fact, you can sample, filter and extend a dataset all at once with only one API request.
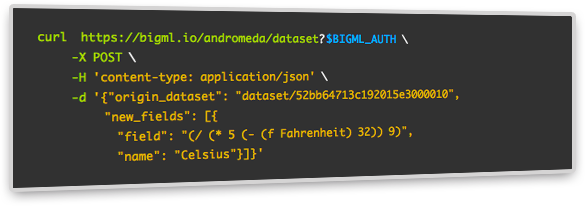
A new Lisp-like language named Flatline allows you to not only filter the rows and columns of a dataset but also generate new fields.
With Flatline you can select different fields in the same row of a dataset or select a finite sliding window of rows to traverse a dataset vertically and apply functions to them. This is useful to generate values based on a number of front and rear values.
If you prefer you can use its JSON-like variant.
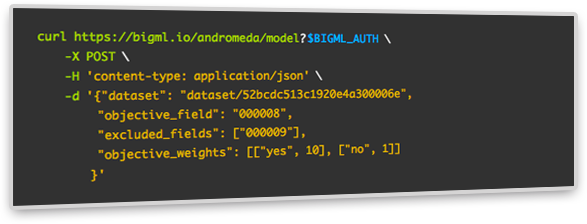
BigML’s latest release comes with three ways to elegantly cope with imbalanced datasets and create weighted models. Using them you’ll be able to build models that will consider at building time every instance or class according to the weight criteria that you establish. Read more in our developers documentation
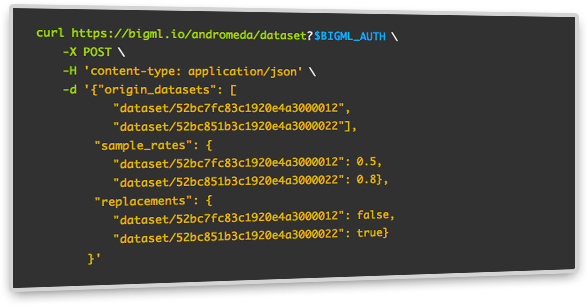
BigML's API allows you to create a dataset using multiple datasets as input. This is very useful when you need to combine multiple sources of data into a single dataset or when you want to build an online solution that collects data in batches.
You can also sample each dataset individually.
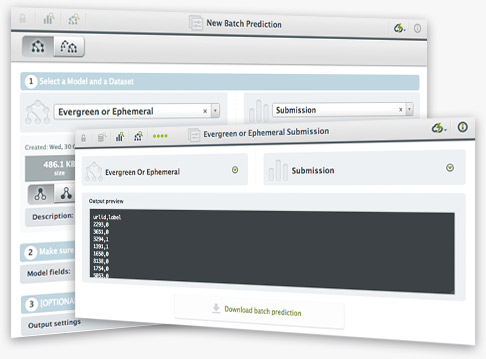
A long-awaited feature is finally here!!! BigML now allows you to create batch predictions for thousands or millions of data points without writing a single line of code. Just upload the data you want to create predictions for, transform it into a dataset and use it together with the model or ensemble to generate a downloadable file with all the predictions. You can give the file multiple formats.
There's also a new BigML.io resource that you can use to programmatically create batch predictions.
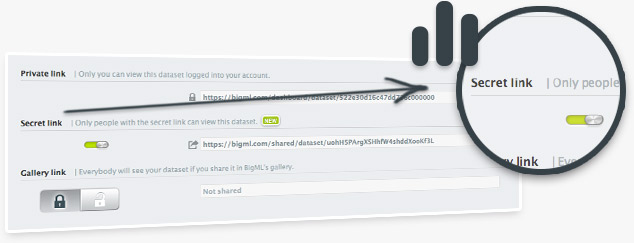
From now on, BigML datasets can be shared through private links analogous to those already available for models.
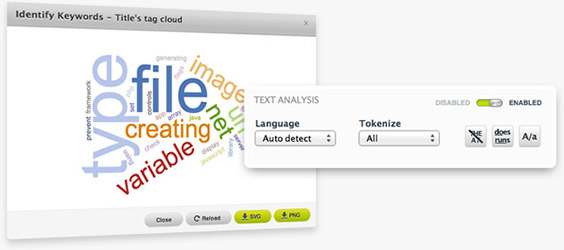
Have you ever wanted to create predictive models using a mix of structured and unstructured data but weren't able to find a package or service available to do so? BigML now allows you to process multiple text fields, alongside numerical, categorical, date and time fields. BigML has implemented a number of basic Natural Language Processing techniques to spot relationships between text content and other properties of your data. For example, wouldn't it be good to know what keywords from your social media feed are resulting in the most social media shares? This is now possible through BigML.
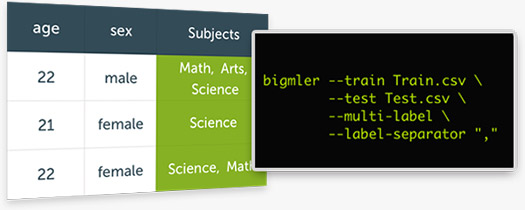
Sometimes you need to assign multiple classes (labels) to your data. For example, what subjects a student will enroll next year? Or, what keywords best describe a text? BigMLer, our command-line tool for Machine Learning, makes multi-label classification very easy: in just one line you can generate a combination of models that will help you predict all the classes to which a new instance belongs.
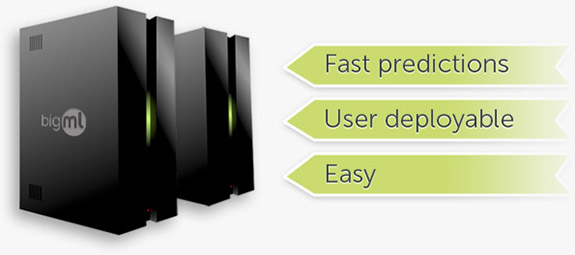
A dedicated server available from Amazon Web Services that lets you run lightning fast predictions against a model or ensemble you created in BigML. Available today in early access form, BigML PredictServer is a great solution for customers that need predictions in real-time or in large batches.
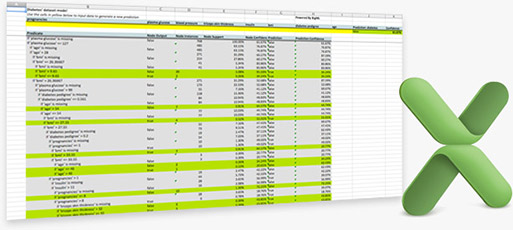
Microsoft Excel is one of the most pervasive “analytics” tools on the market today. Now you can export your BigML models and make them actionable on Excel—letting anyone in your organization make predictions on the go and analyze BigML models from the comfort of their own tools and environment.
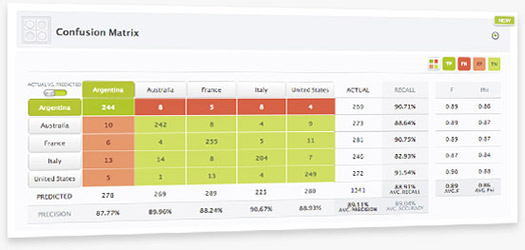
A highly-requested enhancement to BigML’s Evaluations, BigML’s intuitive confusion matrix makes it easy for you to visualize the performance of your classification models and ensembles by quickly showing you the actual vs. predicted results highlighting false negatives and false positives. Also exportable to Microsoft Excel.