
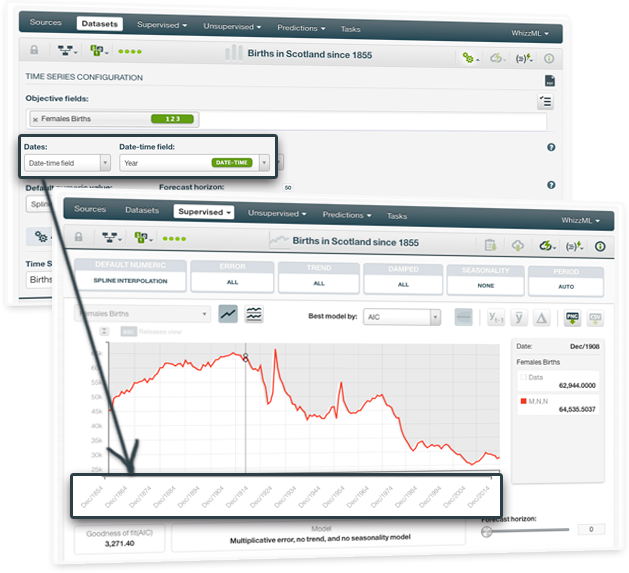
You can now select the date-time field from the dataset to plot your time series data in the Dashboard. Be aware that your instances must be chronologically sorted in the dataset to select the date-time field.
BigML recently launched Time Series, a sequentially indexed representation of your historical data commonly used for predicting stock prices, sales forecasting; website traffic, production, and inventory analysis as well as weather forecasting among other use cases.
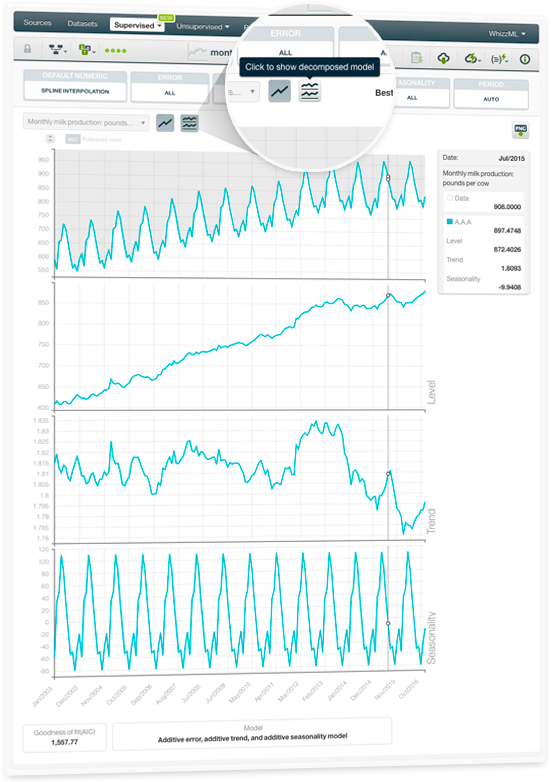
BigML implements exponential smoothing methods which are able to learn multiple models out of the training data by using different combinations of the three essential model components: the level, the trend, and the seasonality. Now, you can decompose your models to display each of these components plotted in a separate chart. For a detailed explanation of each component, please visit the dedicated release page, where you will find a series of six blog posts about Time Series, the BigML Dashboard and API documentation, the webinar slideshow as well as the full webinar recording.
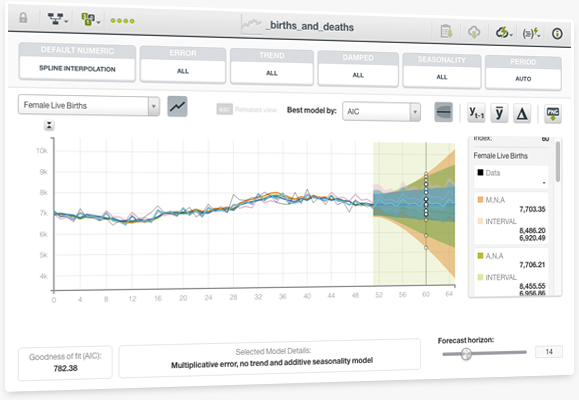
You can use your Time Series models to make predictions, which are called Forecasts. With Time Series Forecasts, you can easily forecast events in short or longer time horizons. You can also employ a Time Series model to forecast the future values of multiple objective fields. Along with each forecasted data point, BigML generates an error interval as a measure of the quality of your forecast. The interval indicates the lower and upper bounds within which the forecast will fall with a 95% confidence.
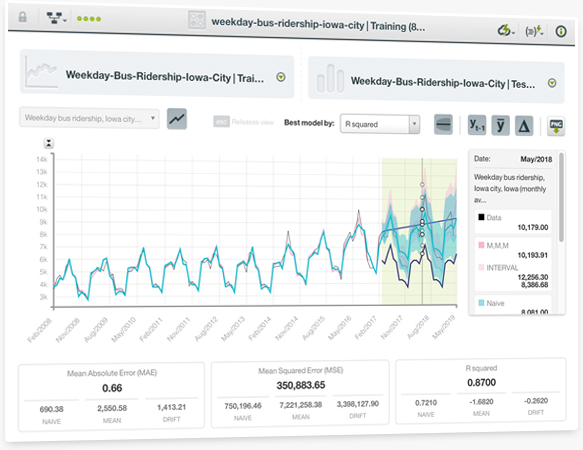
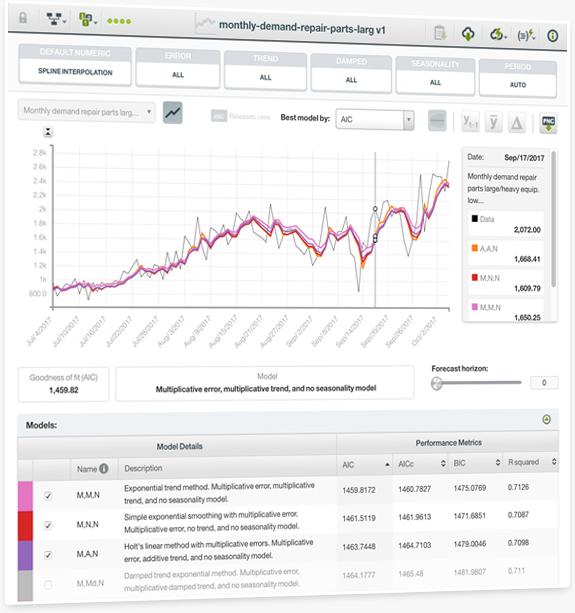
You can easily evaluate the performance of your Time Series models. For this, you need to use two different subsets of data: one for training and the other one for testing. BigML represents your test data and the model forecasts in a chart, so you can visually analyze the goodness-of-fit of your Time Series models.
You will also see multiple performance metrics such as the Mean Absolute Error (MAE), the Mean Squared Error (MSE), the R squared, the Symmetric Mean Absolute Percentage Error (SMAPE), the Mean Scaled Error (MSE), and the Mean Directional Accuracy (MDA). You can find an explanation for each metric in the 6th chapter of the Time Series documentation.
BigML is proud to launch Time Series, a sequentially indexed representation of your historical data that can be used to forecast future values of numerical properties. This is a versatile method often used for predicting stock prices, sales forecasting, website traffic, production and inventory analysis, and weather forecasting, among many other use cases.
A Time Series model needs to be trained with numeric fields containing a time-ordered sequence of regularly spaced data points in time. BigML implements exponential smoothing methods which are able to forecast time-based data with complex trends and seasonal patterns. BigML generates multiple models behind the scenes so you can select the best-performing ones. You can find a detailed explanation in the Time Series documentation.