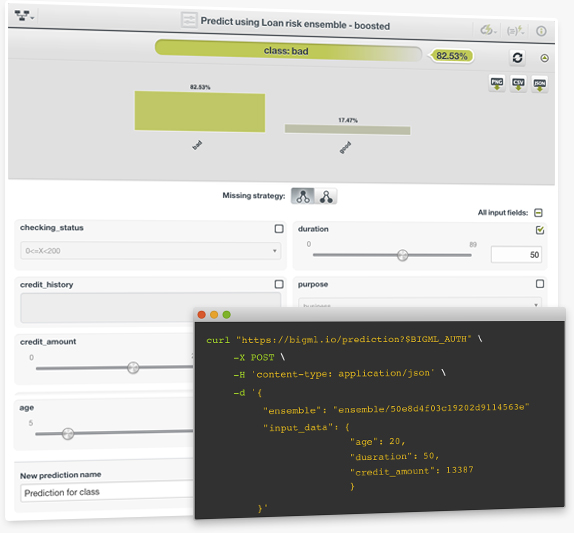
The ultimate goal of creating any supervised learning model is to get a prediction for new intstances. Like other supervised models, Boosted Trees offer Single Predictions to predict a given single instance and Batch Predictions to predict multiple instances simultaneously. Instead of returning a single class along with its confidence, Boosted Trees return a set of probabilities for all the classes in the objective field which is visible in the predictions histogram.
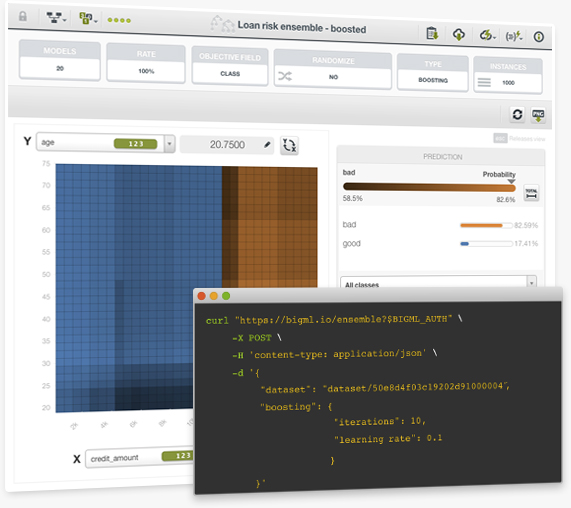
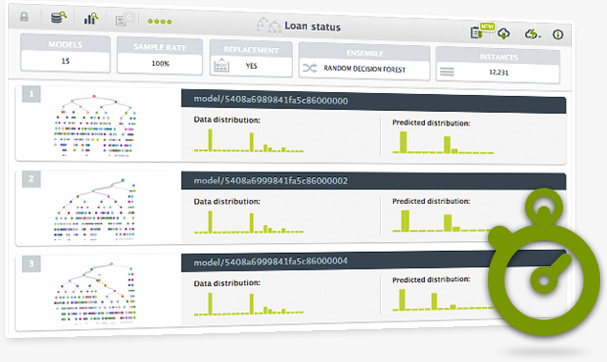
The BigML team is proud to announce Boosted Trees, the third ensemble-based strategy that BigML provides to help you easily solve your classification and regression problems. Together with Bagging and Random Decision Forests, Boosted Trees make for a powerful combination available both via the BigML Dashboard and our REST API. This well-known technique is an ensemble of several single models, where each tree improves the mistakes made by the previously grown tree. It is one of the best performing Machine Learning methods to solve complex real-world problems.
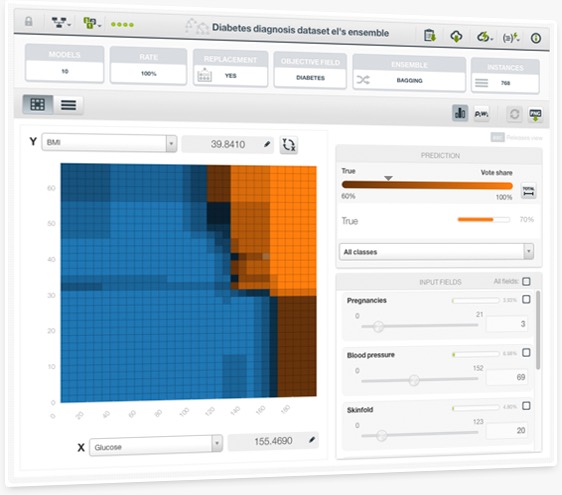
This new visualization for ensembles, commonly known as Partial Dependence Plot, allows you to visualize the impact that a set of fields have on predictions. You will be able to determine which fields are most relevant for ensemble predictions and how sensitive your ensemble predictions are to their different values.
The chart displays a heatmap representation of your predictions based on different values of the two selected fields in the axes regardless of the rest of the fields used to train your ensemble. You can select any categorical or numeric field for the axes and configure the values for the rest of the input fields by using the fields inspector panel on the right.
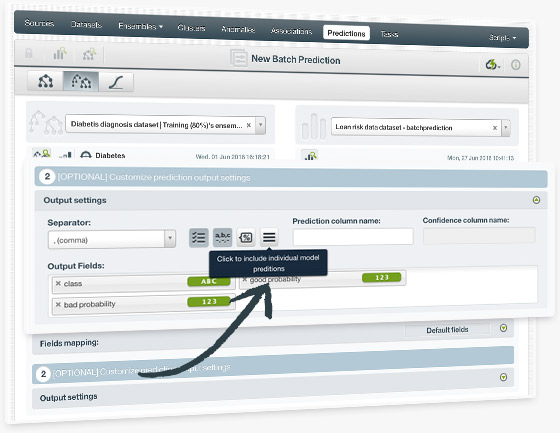
Include all the individual trees predictions within the ensemble when creating a batch prediction. You can also include the confidence or expected error for each individual prediction by enabling the confidence option for the output file. This information will provide you a deeper understanding of the ensemble predictions and a flexible way to compute your preferred prediction combination.
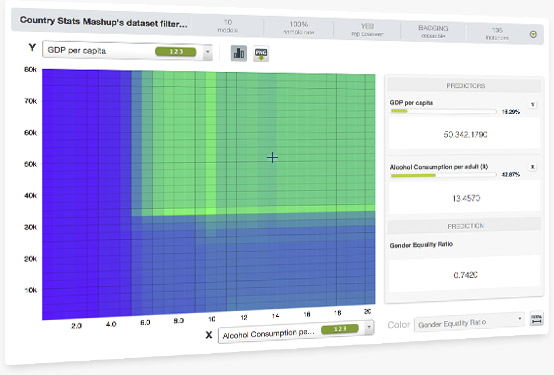
Ensembles are one of the top performing algorithms for most Machine Learning problems, but they are also hard to interpret. Partial Dependence Plot (PDP) is a graphical representation of the ensamble that allows you to visualize the impact that a set of fields have on predictions. BigML provides a configurable two-way PDP where you can select the fields for both axis to analyze how they influence predictions. PDP can be used for regression and classification ensembles.

