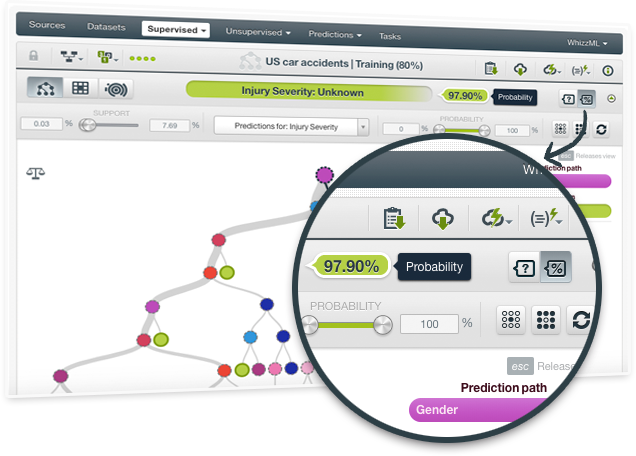
BigML has been always using confidences (a pessimistic approach) to measure the certainty of a given prediction. Now you can decide to also see probabilities for model predictions. The fundamental difference between both measures is that probabilities don't penalize a lower number of instances in a given node so heavily.
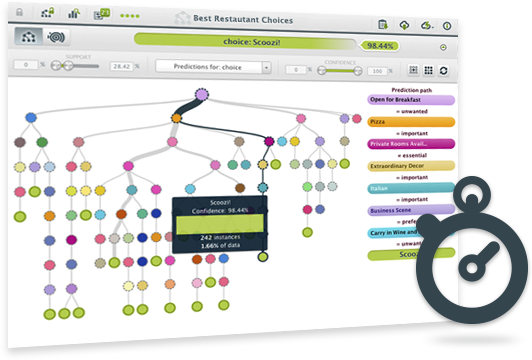
You can see how the three different model visualizations change by playing with the buttons to show confidences or probabilities at the top of the model view.
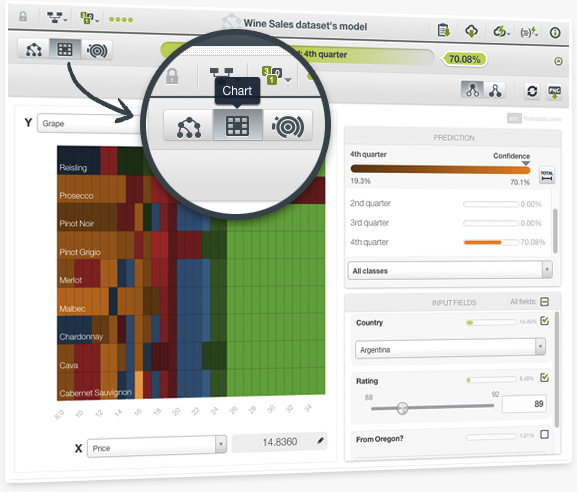
As a complement to our popular decision trees visualization and the sunburst, we are launching a third view for your models: the Partial Dependence Plot. This heatmap chart also allows you to analyze the marginal impact of each input field on predictions for classification and regression models built by using ensembles and logistic regressions.
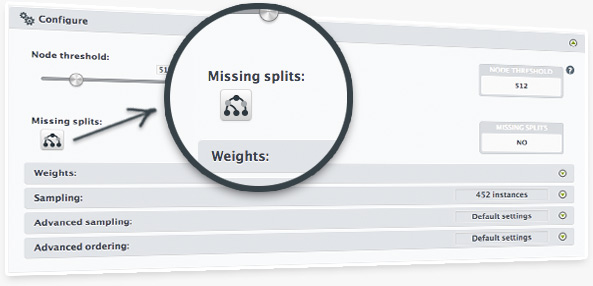
As we know that cleaning up data might be hard and having all the input data handy at prediction time is important, we have built a new option to create models that will generate predicates that explicitly deal with missing values.
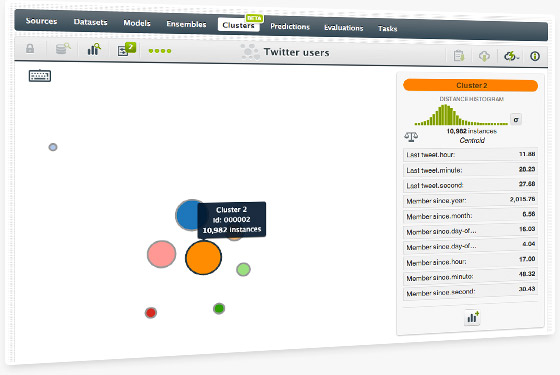
BigML's first unsupervied learning offering enables users to group the most similar instances from your dataset into Clusters. BigML's approach to Clustering is inspired by k-means and features the intuitive workflow and rich visualizations that you've come to expect from our service. Read more on this feature in our blog post.

