
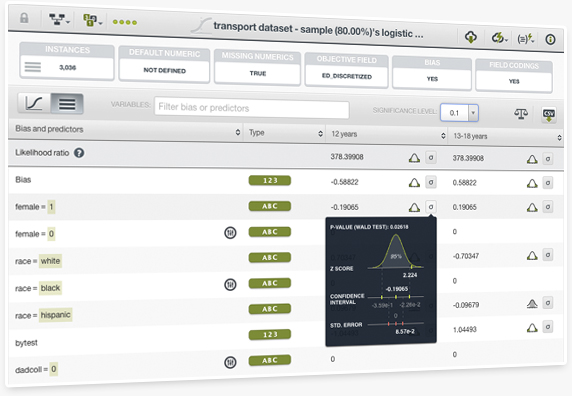
These new Dashboard statistics allow you to introspect the predictive power of your model by revealing the significance of each coefficient estimate. BigML computes the likelihood ratio to test how well the model fits your data along with the p-value, confidence interval, standard, error and Z score for each coefficient.
Learn more about the Logistic Regression statistics in the Dashboard documentation.
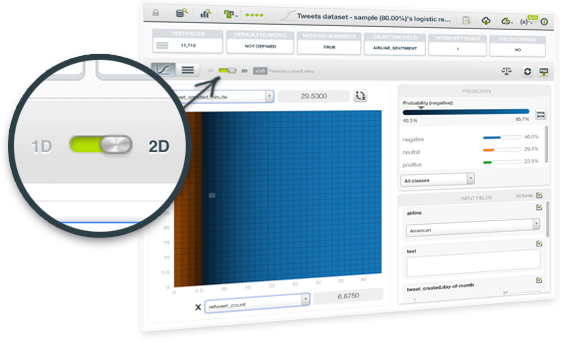
BigML has released the 2D chart for Logistic Regression for you to analyze the impact of two input fields on predictions simultaneously. This view complements the current 1D chart for Logistic Regression. Just select any categorical or numeric field for the axis and the objective class probabilities will be automatically displayed in the heat map chart. You can also configure the rest of input field values using the fields form to the right. To learn more about Logistic Regression, see our Summer 2016 release.
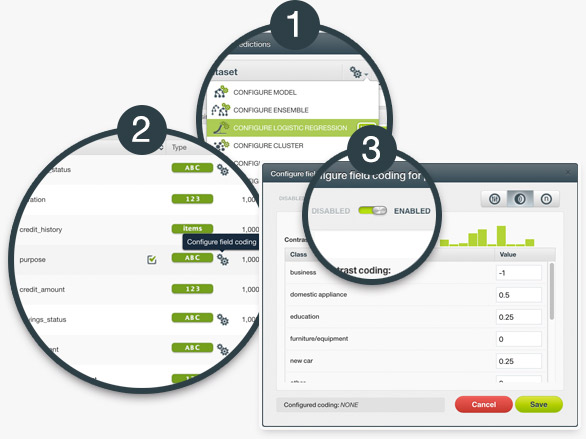
Logistic regression needs numeric variables as input data. In order to support categorical fields, BigML transforms them by using one-hot coding, i.e., mapping to binary values (0s and 1s only). With Field Codings you can encode your categorical fields using three different strategies: dummy coding, contrast coding and other coding. Learn more about the three options in the Dashboard documentation.
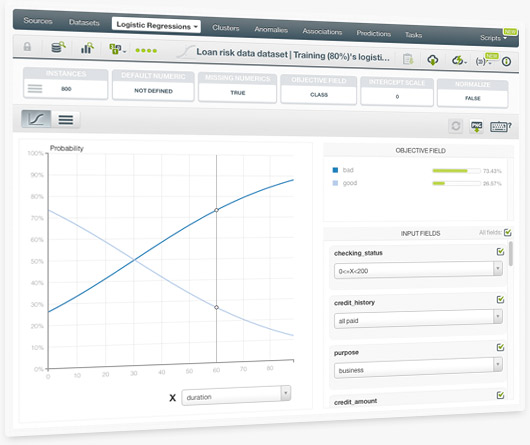
After bringing logistic regression to the API, it is now available in your Dashboard.
BigML is one of very few Machine Learning platforms offering a logistic regression visualization, which includes a twofold view: a chart and a coefficients table. The logistic regression chart provides a visual way to analyze the impact of your input fields on predictions. The table shows all the coefficients learned for each of the logistic function variables, which is ideal for inspecting model results and debugging tasks.
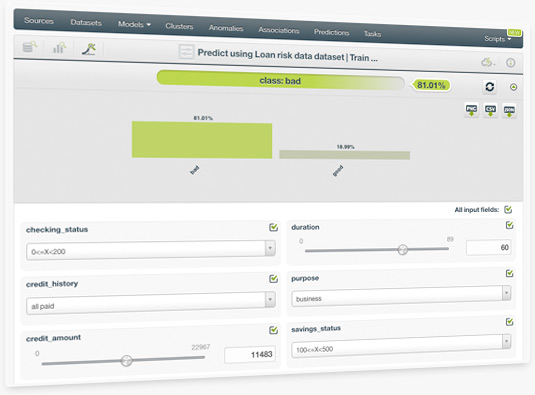
The ultimate goal of creating a logistic regression is to make predictions with it. Easily predict single instances using BigML prediction form —just input the values for the fields used by the logistic regression. You will get the predicted class along with its probability at the top of the view.
BigML also provides all classes probabilities in a visual histogram that changes real-time when you configure the input field values.
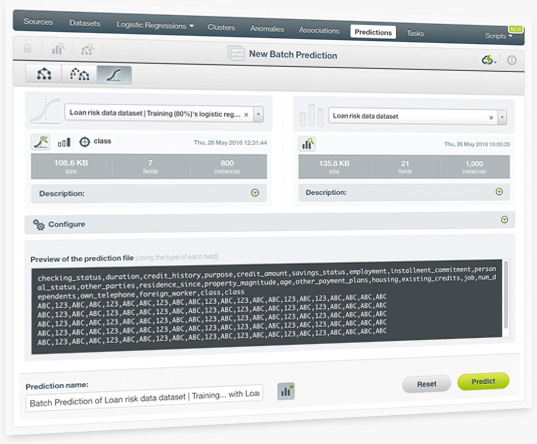
BigML batch predictions allow you to predict multiple instances with one-click. Just select the logistic regression and the dataset containing the data you want to predict, and BigML will automatically generate an output CSV file with a prediction for each of your instances.
You can also configure a wide range of the output file settings, e.g. you can include all the objective field classes probabilities for each of the instances in your dataset.
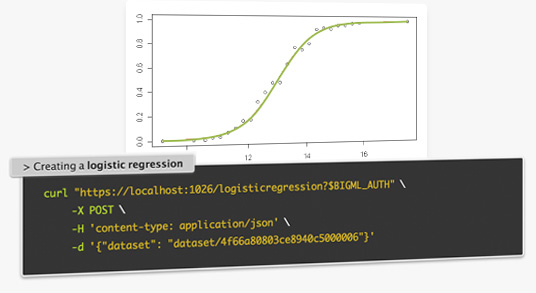
Logistic Regression is a supervised ML model to solve classification problems and it's now available in the API and BigMLer. It can be expressed according to the following formula:
y = 1 / {1 + e^[-logit(p)]}
where logit(p) = b_ 0 + b_ 1 * x_ 1 + ... + b_ k*x_ k
Each of the independent variables (x1, x2... xK) are the predictors of the model. Logistic regression seeks to learn the coefficient values (b0, b1, b2, ... bk) from the training data using non-linear optimization techniques and returns a probability for each of the predicted classes (y).