
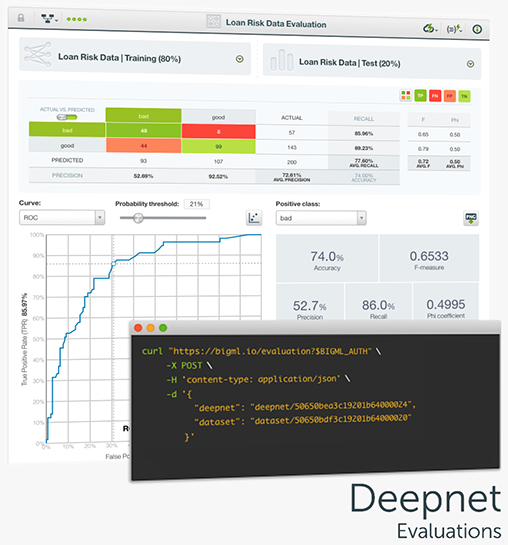
Evaluate the performance of your Deepnets to get an estimate of how good your model will be at making predictions for new data and easily interpret the results with BigML evaluation visualizations. As with other supervised learning models on BigML, Deepnets include the confusion matrix and the ROC and Precision-Recall curves to help you solve classification problems. Furthermore, quickly compare the performance of your different Deepnets and other models built using different algorithms with the BigML evaluation comparison tool.
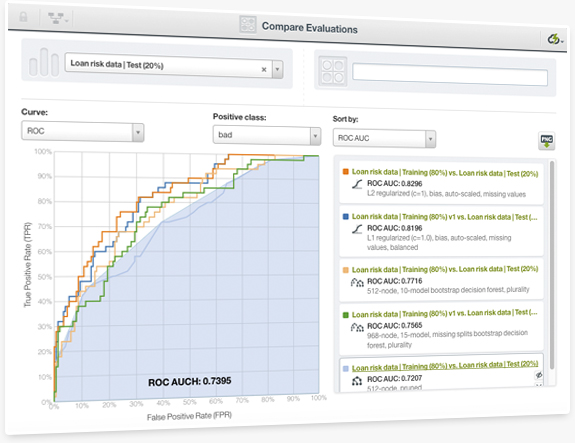
Any classification problem can be solved by using different supervised learning algorithms and using different configurations per algorithm as you iteratively improve your models. BigML brings to the Dashboard an easy and visual way to compare your models and decide which one performs better. You can easily select the models, the positive class, the metrics and any of the ROC curve, the precision-recall curve, the gain curve, or the lift curve for your comparison. You can also rank your models by the Area Under the Curve (AUC), K-S statistic, Kendall's Tau, or Spearman's Rho.
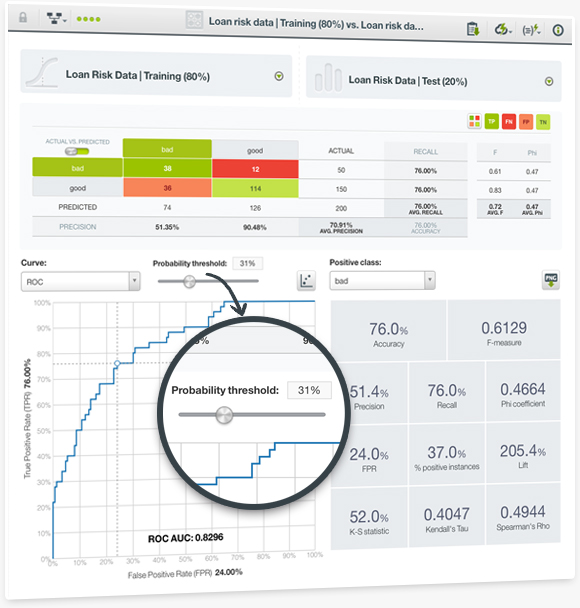
Evaluating the performance of your Machine Learning models is one of the most important steps in the predictive process. BigML is releasing a new Dashboard visualization for evaluations, which includes new performance metrics to make it easier to assess the performance of your classification models. Now, you can use the popular ROC curve to understand the trade-off between sensitivity and specificity for each possible threshold as well as the precision-recall curve, the gain curve, and the lift curve. Moreover, you can find new metrics that measure the overall predictive performance of your models for the selected positive class such as the Area Under the Curve (AUC), the Area Under the Convex Hull (AUCH), the K-S statistic, the Kendall's Tau, and the Spearman's Rho coefficients.
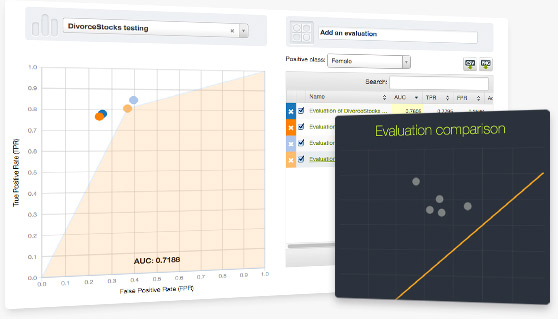
You can now compare multiple evaluations against a test set in a ROC space. The graph can then be downloaded as a .PNG image, and the performance measures can be exported as a .csv for further analyses.